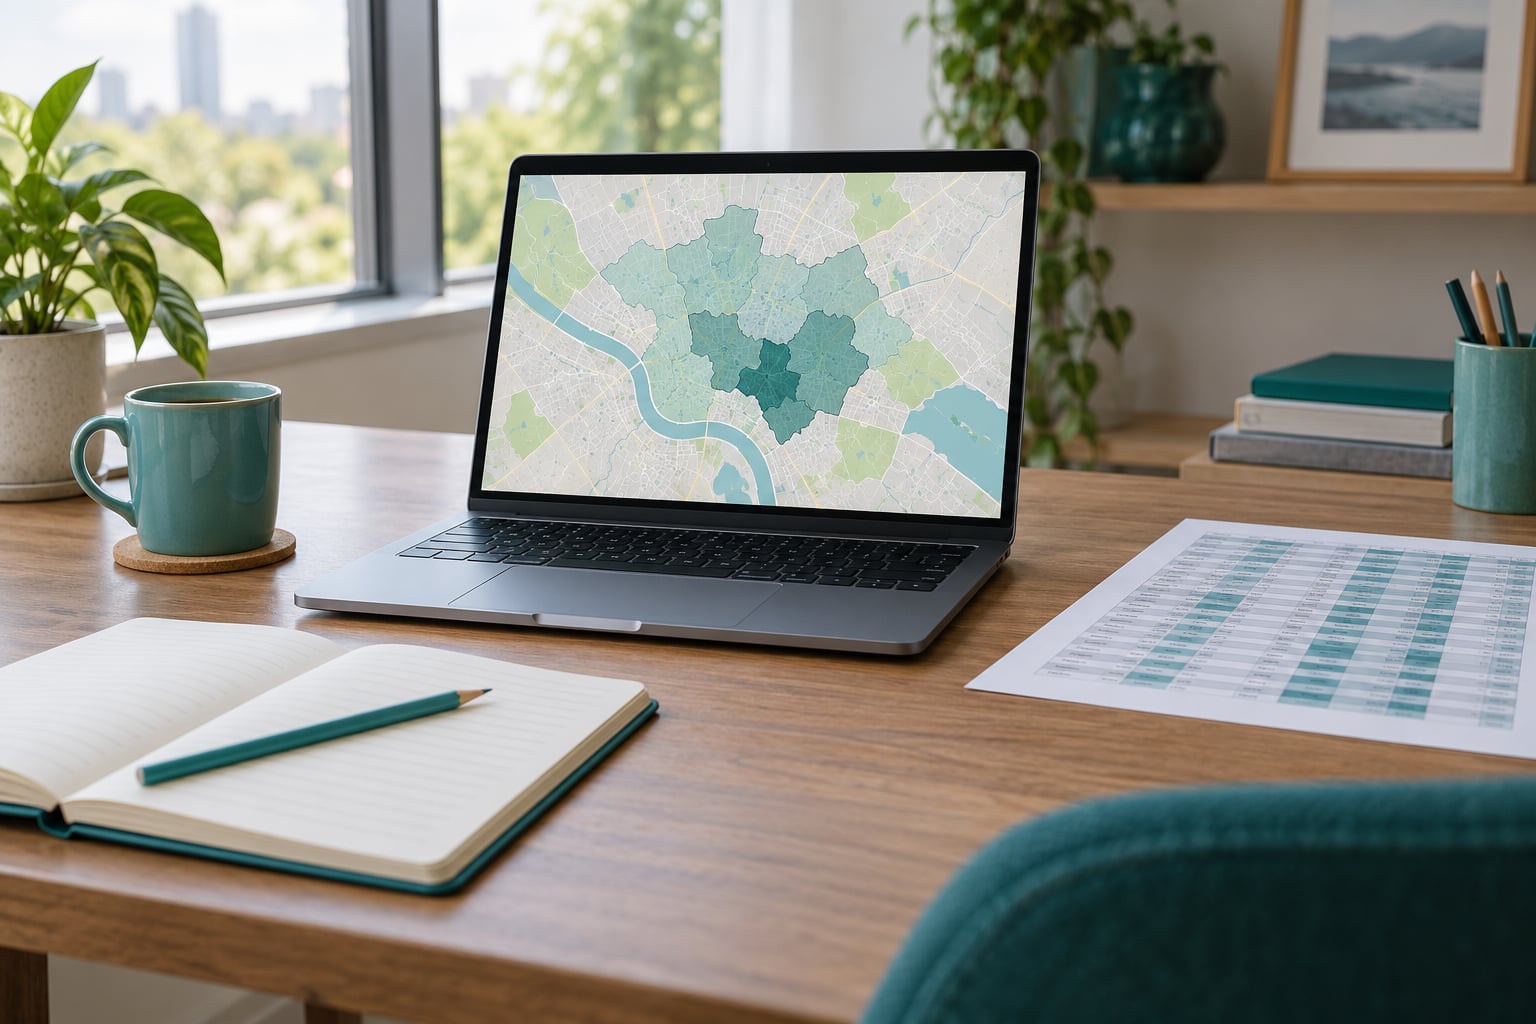
An interactive map for a news story is a web-based map readers can pan, zoom and click, built by joining your data to coordinates so the story’s geography becomes explorable. To learn how to make an interactive map for a news story, you need open data with place names or boundaries, a mapping tool that matches your skill level, a basemap and colour scheme, and about a day of work including a QA pass. The order of operations matters more than the software you pick.
This guide walks the full newsroom pipeline: the editorial question, data validation, tool selection, cleaning, building, annotation, and pre-publish testing. It also covers the parts that get skipped and regretted later, including geocoding errors, misleading colour classes, and the legal question of what to do with the exact location of a victim, a clinic, or a sensitive facility.
What You Need
Most failed newsroom maps are missing one of six things before they start. Check the list before opening any software.
- A dataset with a place. A CSV of addresses, a table with a postcode column, a shapefile of boundaries, or a list of latitude and longitude pairs. If your rows have no geography, the map cannot start.
- Boundary files if you are colouring areas. Census or administrative boundaries at the level you want to show. Counties for a county story, tracts for a neighbourhood story. Never redraw boundaries by hand.
- A tool chosen by skill level. Hosted chart-and-map tools if you are a reporter, a desktop GIS if you do analysis, or a JavaScript library if a developer is on the story. See Step 3 for the split.
- A basemap and a colour scheme chosen before you build. A muted basemap so your data stays in front, and a colourblind-safe palette with a legend that states the classes in plain words.
- A source note written to your desk’s format. Dataset name, publisher, date of retrieval, and any transformation you made. Write it before you forget what you changed.
- A publishing surface that accepts an embed. An iframe from a hosted tool, or a hosted page if your CMS strips scripts. Know this before you build, because it can force a completely different route.
- A second pair of eyes. One person who did not build the map should check every number, label and claim against the source data.
Two more constraints worth deciding early. How large your final data file is affects whether the map loads on a phone, and whether any location in it is sensitive enough that publishing it could harm someone. Both are easier to solve before the first polygon is drawn.
Step-by-Step
The workflow below takes a story question through to a published, tested embed. Seven steps, and the first one decides most of the others.
Step 1: Define the Map’s Editorial Job
Write the reader question in one sentence before anything else. Not “map of incidents” but “which neighbourhoods had more reports than population would predict.” If you cannot finish that sentence, the map has no job yet.
From that sentence, pick the geographic unit. Points suit individual locations like a clinic, a school, or a site. A choropleth suits rates and percentages across areas. A heat map suits density where the exact address should stay vague. Flow lines or arcs suit movement between two places.
| Map type | Data you need | Question it answers | Typical tool |
|---|---|---|---|
| Point map | Addresses or coordinates plus labels | Where is it? | Flourish, Datawrapper, Google My Maps |
| Clustered point map | Many points in a dense area | Where are things concentrated? | Leaflet with a clustering plugin |
| Choropleth | Boundaries plus a rate or count per area | How does this area compare? | Flourish, Datawrapper, QGIS |
| Heat map | Large point volume, address not publishable | Where is the density? | Leaflet or Mapbox with a heat layer |
| Flow or arc map | Origin and destination pairs | How do people or goods move? | QGIS, Python Folium, D3 |
Then write the annotation plan: the three or four things the reader should notice, and the sentence you will attach to each. Readers should get your point without scrolling.
Step 2: Find and Validate the Data
Open data means the data is published and reusable, not that it is clean. Start with the publisher’s own metadata page and read it before downloading anything.
Check four things. How recent is the collection period, and does the date match the period your story describes. Which geographic field exists, and at what level. What the definitions are, because agencies change what counts as a “closure” or a “complaint”. And what the known gaps are, such as suppressed small areas or incomplete rural coverage.
Download the raw file and keep it. Do not edit it in place. Every later transformation goes in a script or a documented chain of steps, so that when the publisher revises the numbers in six months you can rebuild rather than patch. Version-control the data folder with the same discipline you give code; reporters who skip this end up with a map nobody can reproduce, including themselves.
Step 3: Choose the Right Mapping Tool
Pick the lightest tool that produces the map you described in Step 1. Heavyweight GIS and custom JavaScript are worth it only when the map needs analysis or a visual treatment a hosted template cannot do.
| Tool | Skill level | Free tier | Best for | Embeddable |
|---|---|---|---|---|
| Flourish | None | Yes, with limits | Storytelling maps, scrollytelling, animated time series | Yes |
| Datawrapper | None | Yes, with limits | Newsroom chart and map standards, choropleths | Yes |
| Google My Maps | None | Yes | A quick annotated list of locations | Limited, iframe only |
| MapShaper | Low | Yes | Converting and simplifying shapefiles in the browser | Exports GeoJSON |
| QGIS | Medium | Yes, open source | Geoprocessing, joins, buffers, projections | Exports assets only |
| Leaflet | Medium to high | Yes, open source | Custom point maps, clustering, heat layers | Yes, with a host |
| Python Folium | Medium | Yes, open source | Quick reproducible maps from a notebook | Yes, self-contained HTML |
A few honest notes from people who do this daily. Flourish and Datawrapper are the default answer for reporters with no coding background, and their map templates limit you once you want custom behaviour. Leaflet is the most common route when you need precise control, at the cost of a real learning curve. ArcGIS is powerful but often unreachable for smaller outlets, which is why Leaflet and PostGIS come up so often when the budget is zero. Some strong mapping features, including parts of hosted spatial databases, sit behind paid tiers that shut smaller newsrooms out.
One more practical point: whatever you choose has to survive contact with your CMS. Test an embed early, before building the whole thing, because a newsroom CMS that strips scripts will send you to a different tool entirely.
Step 4: Clean and Prepare the Spatial Data
Geocoding turns place names into latitude and longitude pairs. It is the step where most projects slow down, because bulk geocoders return flagged, ambiguous or unmatched rows that a human has to review.
Run your list through a bulk geocoder, then triage the output into three piles: confident matches, ambiguous matches you fix by hand, and no match at all. Check that confident matches actually landed on the right street. A geocoder given “Main St, Springfield” will happily return a Main Street somewhere else, and that error survives all the way to publication.
Spot-check ten rows against a real address service and against your own knowledge of the area. If more than one in ten is wrong, your input needs cleaning before geocoding, not after.
Then fix the geometry. Standardise place names so joins work. Delete or flag impossible coordinates, which usually arrive as a longitude of 999 or a latitude past 90. If you are drawing areas, join your statistics to the boundary file by its official identifier rather than by name, because names repeat and get renamed.
Finally, simplify. A detailed boundary file can be tens of megabytes and will crawl on a phone. Most news maps look identical above a certain zoom, so reducing coordinate precision and dropping tiny interior islands usually cuts file size dramatically with no visible change. Do this in MapShaper for a quick pass or in QGIS for a proper topology-preserving simplify. A useful habit: aim for a final GeoJSON in the low single-digit megabytes, then check the actual load time on a throttled connection rather than trusting the file size alone.
Step 5: Build the Map and Add Reader Controls
Build in this order: basemap, data layer, colour or symbol encoding, then interactivity. Starting with the interactivity means tuning it later, which wastes the effort.
Choose a muted basemap so the data reads clearly on top. Then encode. Use colour for a continuous measure and symbols for categories, and never let one map carry more than two encodings at once. Six different marker colours plus four marker sizes plus line width is a map nobody can decode.
| Interactive element | What it does | When it earns its place |
|---|---|---|
| Tooltip on hover | Shows a value without a click | Point maps with one clear number per point |
| Click popup | Opens a small panel with detail | Points that need a date, a name, a link |
| Layer toggle | Switches series on and off | Two or three overlapping series |
| Zoom and reset | Returns the reader to the opening view | Any map that is not one static view |
| Legend with class breaks | Names the colour bands in words | Every choropleth, no exceptions |
Keep tooltips to a few words. A tooltip that repeats the whole article paragraph is a popup nobody opens. Give the map a reset control so a reader who pans away can get back, and put the title inside the image rather than only above it, because toolbars and sticky headers crop the top of an embed.
Add a static fallback. A single image at the opening view, with the key numbers in the caption, means the story still works when the embed is blocked, fails, or loads on a connection too slow to use.
Step 6: Write the Annotations and Story Context
The map is a paragraph in the story, and it needs a dek, a caption, and a source note that sit with it. Write a one-line summary of what the reader is looking at, state the data source and the date range below it, and link a short methodology note that explains your transformations.
Then annotate. Three or four callouts pointing at the pattern your reporting found are usually enough. Each annotation should state what is visible in the data, not what you wish it meant. “Reported cases per 10,000 residents, 2026” is a fact. “The city is failing this neighbourhood” is a conclusion the map does not support.
If your data carries uncertainty, show it. Where counts are small, say so in the caption, because a single incident and a cluster of three look identical on a map and mean very different things.
If any location could identify a vulnerable person, a protected facility, or a site tied to an incident, decide now what to publish. Common practice is to drop precise coordinates, aggregate to a wider area, offset the point to the centre of the area, or remove it and note the removal in the methodology. Check with your editor and, where the risk is real, with legal. A map that redacts specific points and says so is more credible than one that silently omits them.
Step 7: Test, Publish, and Measure
Run a pre-publish pass before the story goes live, and do it on a real phone on mobile data rather than office wifi.
- Fact-check the map itself. Have someone who did not build it recompute a handful of values from the source file and compare them to what the map shows.
- Check the geocoding. Open ten random markers and confirm each is where the label says.
- Check the class breaks. Confirm the choropleth bands are labelled with real values and that a reader cannot mistake a small difference for a large one.
- Test on mobile. Load it on a phone, pinch-zoom it, tap a marker with a thumb, and time it.
- Test with a keyboard and a screen reader. Every control needs a focus state and a label. Provide a text description of what the map shows and a table of the underlying values.
- Test in three browsers and in an incognito window, since stale caching hides broken embeds.
- Confirm the fallback. Block the embed deliberately and check the story still reads.
Give the embed a descriptive title and alt text that says what the map shows, not “interactive map”. After publication, watch how readers use it: how many interact at all, whether the map loads on mobile, and whether anyone clicks through to the underlying data. A map almost nobody opens usually means the reader question was wrong, not that the tool was.
Common Mistakes
Seven failures come up repeatedly in newsroom map projects, and each has a straightforward fix.
Building the map before deciding the question. Start with the map because maps are fun, then find a story to hang it on. Write the reader question first, in one sentence, and check every layer against it.
Unclear colour classes. A choropleth with five auto-generated bands invites readers to see a cliff where the data shows a gentle slope. Choose your own breaks, state them in the legend, and prefer quantile or equal-interval only when you have checked the distribution.
Geocoding errors carried straight to publication. Ambiguous matches and wrong cities look plausible on a map, which is exactly why nobody catches them. Triage every match and spot-check by hand.
Overloading the design. More layers, more colours and more symbols reduce comprehension rather than adding detail. Cut anything that does not serve the sentence you wrote in Step 1.
Omitting the source and the date. A map without a visible source is unsourced reporting. Put the publisher, the period covered and the retrieval date on the graphic itself.
Ignoring file size and mobile performance. An unsimplified geometry file that works on a laptop can leave phone readers waiting. Simplify, host the data file yourself, and measure real load time.
Publishing without context or an alternative. No fallback image, no data table, no text description. Readers on slow connections, screen reader users and readers whose browser blocks the embed all get nothing.
One more that is easy to miss: publishing precise coordinates that could identify someone at risk. Decide the redaction level before you build, not after a source calls you.
Frequently Asked Questions
Do journalists need to know how to code to make an interactive map?
No. Most point maps and choropleths for a news story can be built without code in Flourish, Datawrapper or Google My Maps by uploading a spreadsheet and choosing a map template. You do need code when you want custom behaviour, dense clustering, heat layers or a scrollytelling sequence, which usually means handing the build to a developer or learning Leaflet, which is a well-documented open-source library.
What data format does an interactive map need?
For points, a CSV with latitude and longitude columns is enough. For coloured areas, you need a boundary file such as GeoJSON, a shapefile or TopoJSON, plus a table of values to join to it by official area identifier. Flat files are easier to host and version-control than databases, and for news projects flat is almost always the right choice.
Are there free interactive map tools for news organizations?
Yes. Flourish and Datawrapper have free tiers with limits on volume and branding, Google My Maps is free, and Leaflet, QGIS, MapShaper and Python Folium are free and open source. The trade-off is that free hosted tiers can cap unpublished project counts, and some stronger mapping features sit behind paid plans that smaller newsrooms find hard to justify.
How do I embed an interactive map in a news article?
Hosted tools give you an embed snippet, usually an iframe, that you paste into your CMS in a custom HTML or embed block. If your CMS strips scripts, host the map yourself and point an iframe at the page instead. Either way, test the embed on a phone before publication and keep a static image as a fallback in case the interactive version does not load.
How do you make a news map accessible to screen reader users?
Give the embed a descriptive title and alt text explaining what the map shows rather than calling it an interactive map. Make sure every control is reachable by keyboard with visible focus, and publish a text description plus a table of the underlying values near the map. Alt text alone is not enough, because it cannot convey the pattern the map is showing.
Start With the Reader Question
If you take one thing from this guide, make it the first step rather than the last. Write the single question the map must answer, then choose the simplest data and format that can answer it honestly.
- Finish this sentence: “After reading this, the reader should know…”
- Pick the map type that matches the question, not the one that looks nicest.
- Choose the lightest tool that produces it.
- Decide the redaction level for any sensitive location.
- Simplify the geometry and test the embed on a phone.
- Have someone who did not build it fact-check every value.
Get those six right and the software choice stops being the hard part.