The fastest way to learn Python for data journalism is to work through real reporting projects in a browser notebook, starting with syntax and moving up to cleaning, analysis, and charts. At roughly five hours a week, most reporters can load and clean a public dataset in six to eight weeks and publish their first notebook-backed story in three to six months.
That route skips the part where beginners disappear into generic programming courses. You learn variables because you need to rename a column, and you learn a loop because you have 400 documents to pull apart.
Table of Contents
- What You Need
- Step-by-Step: How to Learn Python for Data Journalism
- Step 1: Learn the Python Basics You Actually Need
- Step 2: Work With CSV, JSON, and Spreadsheet Data
- Step 3: Clean and Validate Messy Real-World Data
- Step 4: Analyze Data for a Reporting Question
- Step 5: Create Charts, Maps, and Interactive Visuals
- Step 6: Build and Publish a Newsroom Project
- How to Learn Python for Data Journalism After Your First Story
- Common Mistakes
- Frequently Asked Questions
- Do I need programming experience to learn Python for data journalism?
- How long does it take to learn Python for data journalism?
- Which Python libraries should journalists learn first?
- Can I use Python instead of Excel for data analysis?
- Do I need advanced math to become a data journalist?
- What kind of portfolio project should I build while learning?
- Conclusion
What You Need
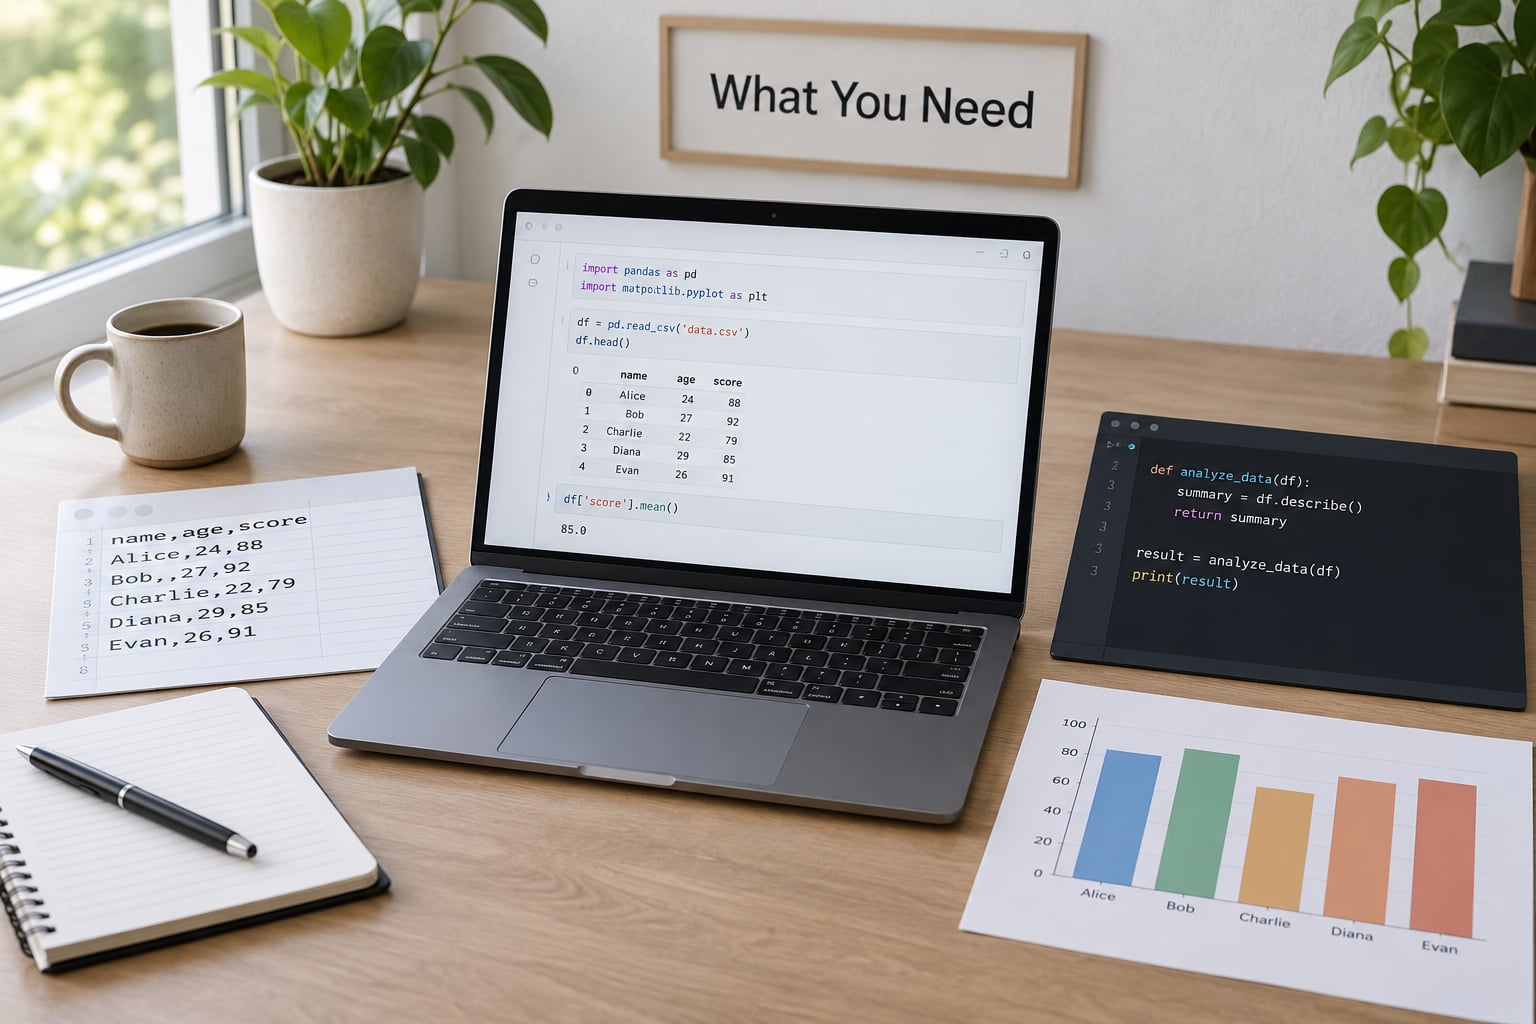
You need four things: a place to write code, Python itself, a handful of libraries, and a dataset with a real question attached to it. The order matters more than the budget. Most people who quit Python for data journalism quit during installation, not during analysis.
Start in the browser. Three zero-install options let you write and run Python without touching your computer’s settings:
- Google Colab runs in a browser tab with pandas and NumPy already loaded. Best for your first month, and the easiest to share with an editor later.
- JupyterLite runs entirely in your browser with no account and no internet connection. It is the setup used by the Stanford Graduate Journalism Program notebooks.
- GitHub Codespaces gives you a real install in a browser tab, which makes it a decent bridge to a local setup later.
Install Python locally with Anaconda only once you are keeping projects rather than trying things out. Anaconda bundles Python, Jupyter Notebook, and the data libraries in one installer, which removes most version conflicts.
| Environment | Setup effort | Best for |
|---|---|---|
| Google Colab | None, sign in and run | Your first weeks and quick analysis for a deadline |
| JupyterLite | None, nothing to install | Offline practice and classrooms |
| GitHub Codespaces | Low, browser based | Learning Git alongside Python |
| Anaconda plus Jupyter | One installer, one afternoon | Daily use and versioned projects |
Four definitions carry most of the work. A Jupyter Notebook is a document that mixes code, its output, and your written explanation in one file. pandas is a Python library for loading, cleaning, and grouping tabular data. A dataframe is the pandas object holding your loaded table. Web scraping is extracting data from web pages that offer no download button.
Two non-technical habits matter as much as the software. Keep your raw downloads in a folder you never edit, and write down what each column means before you analyze it. Reporters who skip the data dictionary end up publishing numbers they cannot defend.
Step-by-Step: How to Learn Python for Data Journalism
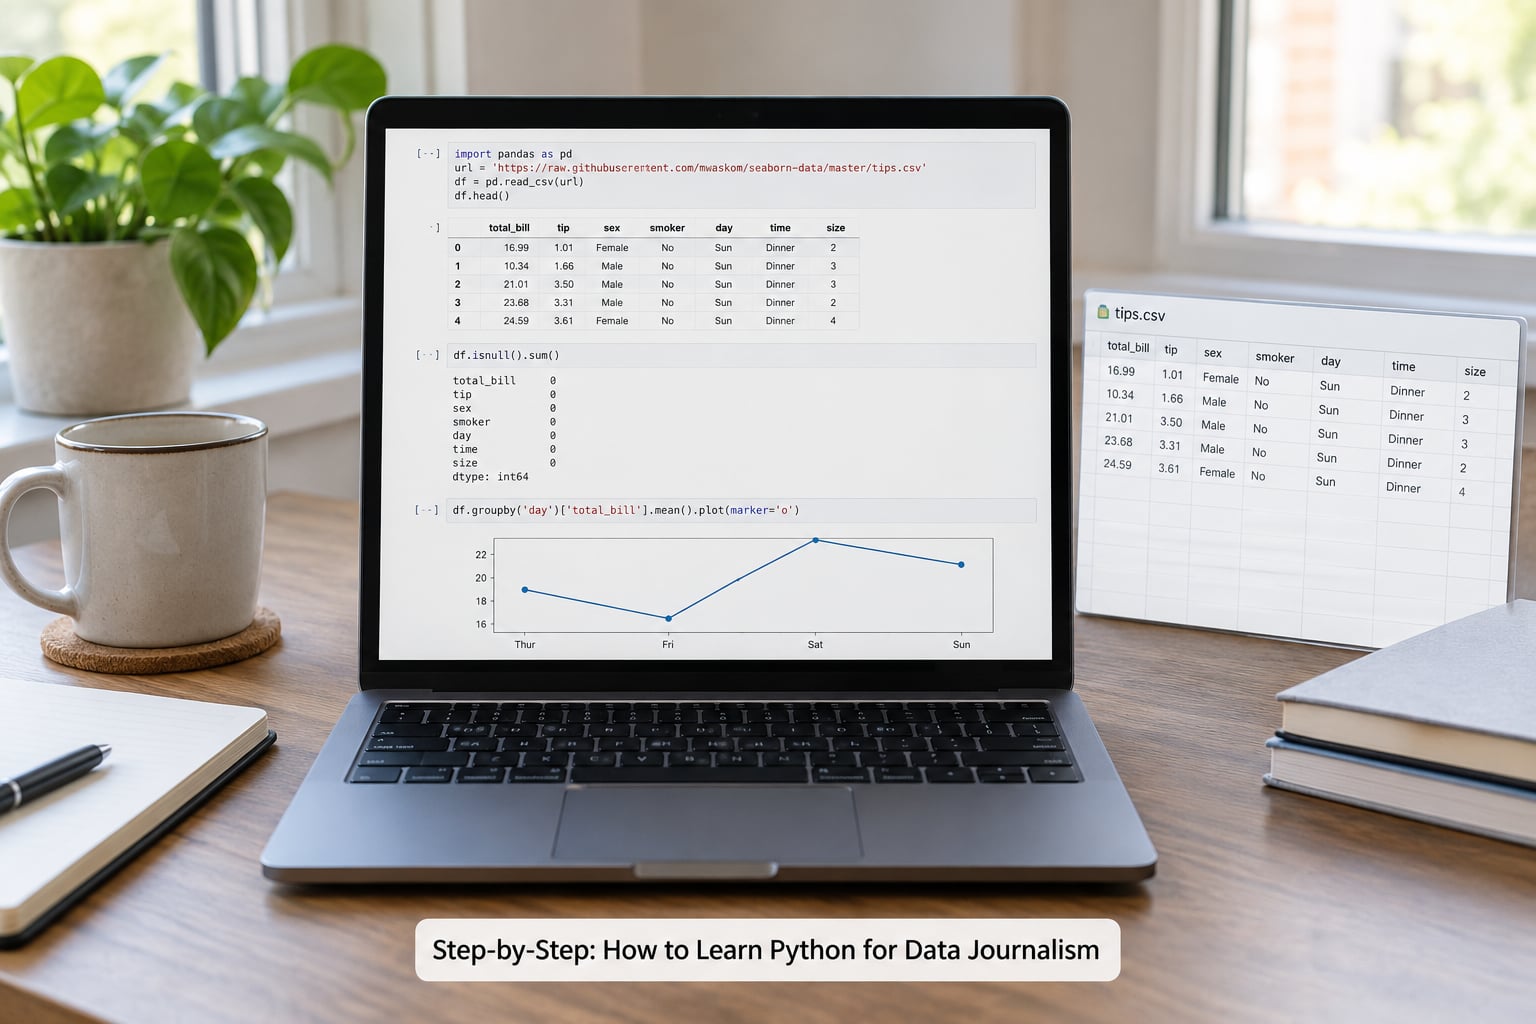
Six stages, in this order. Each one produces an artifact you can show an editor, which is what keeps the momentum going when the syntax gets boring.
| Stage | Weeks | Skills | Output artifact |
|---|---|---|---|
| 0. Newsroom foundations | 1 | Open data portals, FOIA formats, spreadsheet sanity checks | A spreadsheet analysis you can defend |
| 1. Python fundamentals | 2-3 | Variables, lists, dictionaries, loops, functions | A notebook that renames and counts columns |
| 2. Loading data | 1 | read_csv, JSON, Excel via openpyxl | A dataframe you have inspected |
| 3. Cleaning | 2 | Types, duplicates, missing values, dates | A validated, deduplicated table |
| 4. Analysis | 2-3 | Filtering, groupby, sorting, joins, basic stats | An answer to a reporting question |
| 5. Visualization | 2 | matplotlib, seaborn, GeoPandas, chart judgment | A publication-ready chart |
| 6. Publishing | 2-4 | Method notes, Git, notebook export | A published story with a public notebook |
Step 1: Learn the Python Basics You Actually Need
You can ignore classes, decorators, and object-oriented design for months. Roughly 20% of Python carries about 80% of your newsroom work, and that slice is small.
- Variables and strings hold names and values, like storing a county name before you loop over counties.
- Lists and dictionaries hold rows and field-value pairs. Every dataframe you will ever load is a dressed-up version of this.
- Conditionals (if, else) let you flag rows, such as marking every contract above a threshold.
- Loops apply one action to many things, such as rewriting 300 filenames.
- Functions package repeatable work so you stop copying the same six lines.
- Imports bring in pandas and the other libraries. Most errors beginners hit come from skipping this.
Read the error message rather than panicking. An error tells you the line number and the type of problem, and the fix is usually one of a few dozen recurring shapes: a missing bracket, a wrong capital letter, a comma where a dot belongs.
Expect this stage to feel slow for two weeks. That plateau is where most people quit, and it is not a sign you lack talent.
Step 2: Work With CSV, JSON, and Spreadsheet Data
Loading a file is one line, and understanding what comes back is the actual lesson.
import pandas as pd
df = pd.read_csv("contracts.csv")
df.head()
df.shape
df.dtypes
Four things to check every time. How many rows and columns came back, because a truncated file looks like a real one. What types each column holds, because a dollar sign turns a number into text. How many missing values sit in each column. And whether the headers match what the source documentation promised.
Spreadsheets need pandas too. The openpyxl library reads Excel files, which turns any spreadsheet you already trust into a dataframe you can join against other data.
Step 3: Clean and Validate Messy Real-World Data
Real public data is ugly. It has currency symbols, two date formats in one column, blank cells that mean zero and blank cells that mean unknown, and duplicate records that inflate every count you make.
df["amount"] = df["amount"].str.replace("$", "", regex=False).astype(float)
df["date"] = pd.to_datetime(df["date"], errors="coerce")
df = df.drop_duplicates()
print(df.isna().sum())
Cleaning is where accuracy lives. A column that looks numeric but contains “1,200” will silently group as text and produce a chart with one bar. Coerce it, count what failed, and note how many rows you dropped.
Three checks before you trust the table. Confirm the row count matches what the source claims. Look for the same entity appearing under several spellings. And check whether the period covered is what you think it is, because datasets often start mid-year without saying so.
Step 4: Analyze Data for a Reporting Question
Analysis starts from a question a reader would care about, not from a list of columns. “Which vendors got paid the most before an election” is a question. “Exploration” is not.
top = (df.groupby("vendor")["amount"]
         .sum()
         .sort_values(ascending=False)
         .head(10))
Filtering narrows rows, grouping collapses them, and joining brings a second dataset in on a shared key. Add percent change, medians instead of means when values are skewed, and a simple count of records behind each figure.
SQL is worth learning alongside Python if you query an existing database rather than download a file, since it is faster for pulling records and nothing to install. For everything else, pandas covers it.
Step 5: Create Charts, Maps, and Interactive Visuals
matplotlib handles precise, static charts and seaborn handles quick looks at distributions. GeoPandas joins geographic boundaries to your table when the story is about place.
import matplotlib.pyplot as plt
top.sort_values().plot(kind="barh")
plt.xlabel("Total paid")
plt.show()
Chart judgment matters more than library choice. Start the bar axis at zero, label units and the reporting period directly on the chart, avoid 3D anything, and show the range when a number comes from a sample.
For the web side, Datawrapper and Flourish are often faster than writing your own chart code. Do the heavy analysis in Python, then hand the finished numbers to a presentation tool and say so in your methodology note.
Step 6: Build and Publish a Newsroom Project
The terminal milestone of this roadmap is a published story, not a completed course. Reproducibility means being able to re-run your analysis and get the same numbers, and it is the strongest defense you have when an editor or a critic asks where a figure came from.
Five things to do before you publish:
- Commit the raw files in a separate folder so nobody edits them by accident.
- Keep the notebook top to bottom and clean it up before anyone else reads it.
- Write a short methods note: where the data came from, the date range, what you excluded, and why.
- Store the notebook in Git so every change to the analysis is versioned.
- Publish the notebook publicly with a service like GitHub Pages when your newsroom allows it.
Expect the first story to take far longer than the analysis itself. One intern described her first landlord-violation project as two months of trial and error, and she was right that the struggle was the point.
How to Learn Python for Data Journalism After Your First Story
From here the path is reading other people’s notebooks and publishing again. Follow working journalists who publish their methods, join a hackathon or a local NICAR chapter, and treat every repetitive task at work as a candidate for a script.
Free material worth more than most paid courses: the Stanford Graduate Journalism Program notebooks for zero-install practice, Jonathan Soma’s introductions for journalists, NICAR training sessions, Automate the Boring Stuff for general Python, and Kaggle for datasets that come with questions attached. Paid platforms make sense mainly if you want deadlines and accountability, not better content.
Common Mistakes
Staying in the tutorial loop. You finish courses, feel fluent, then freeze on a real file and open another course. Fix: cap yourself at two syntax lessons before every exercise, and make each new skill earn its place in a live project.
Learning passively. Hours of video produce very little you can use without writing code yourself. Fix: type every example out rather than running it, and keep the 70/30 split between practice and study.
Starting with machine learning. Nobody doing accountability reporting needs neural networks in month one. Fix: stay with pandas and charts until you can finish a full story, then revisit.
Skipping Git. When an analysis breaks three weeks later, an editor wants the previous version. Fix: commit your notebook every time it produces a result you might use.
Trusting AI output without checking it. Assistants write plausible code that runs and quietly does the wrong thing. A dropped row or an off-by-one filter produces a false number, and false numbers are the failure mode a newsroom cannot absorb. Fix: verify every line against the official documentation, never paste unpublished source documents into a consumer chatbot, and disclose AI help according to your newsroom’s policy.
Publishing numbers you cannot explain. Missing a duplicate-record check is the quiet killer. Fix: write your methods note while you clean, not after publication.
Frequently Asked Questions
Do I need programming experience to learn Python for data journalism?
No. Most people who do this well started with zero coding experience, usually in a spreadsheet job. You need comfort with percentages, sorting, and arguing about what a number means, which reporters already have. The syntax comes faster than people expect because they are learning it to solve one problem rather than to pass a course.
How long does it take to learn Python for data journalism?
At about five hours a week, most reporters can load, clean, and summarize a public dataset in six to eight weeks. Confident independent analysis takes three to six months. A finished published story usually lands somewhere between two and four months, because the writing and source checks take as long as the code.
Which Python libraries should journalists learn first?
pandas first, because it loads, cleans, groups, and joins tabular data. Then matplotlib or seaborn for charts, openpyxl if you work with Excel files, requests and BeautifulSoup when you need web scraping, and GeoPandas for map-based stories. Learn them in that order and only when a story needs them.
Can I use Python instead of Excel for data analysis?
For most reporting work, yes. Python handles files too large for Excel, repeats a cleaning step across dozens of files, and keeps a record of every transformation you made. Excel still wins for quick look-at-the-number checks, so keep both rather than declaring a winner.
Do I need advanced math to become a data journalist?
No. You need percentages, ratios, averages, and enough statistics to read a study critically. Calculus and advanced theory rarely come up in accountability reporting. Journalists who spent years avoiding math classes describe the same pattern: the code felt hard, the statistics were fine.
What kind of portfolio project should I build while learning?
Pick a public dataset tied to a question a reader would ask, such as spending records, campaign filings, or inspection reports. Publish the notebook alongside a short write-up explaining what you did and what you excluded. Two or three finished projects beat a dozen tutorial exercises.
Conclusion
Open Google Colab and load one real public dataset today, then print its shape and its column types. That single cell is the whole roadmap compressed: install nothing, use real data, and let the next lesson come from whatever the file surprises you with.
Learning Python for data journalism works as a sequence of reporting projects rather than a course of record. Every stage above ends with something you can point at, and the stages after your first published story are simply more of the same habit. Pick a beat, find a dataset on your beat, and start typing.