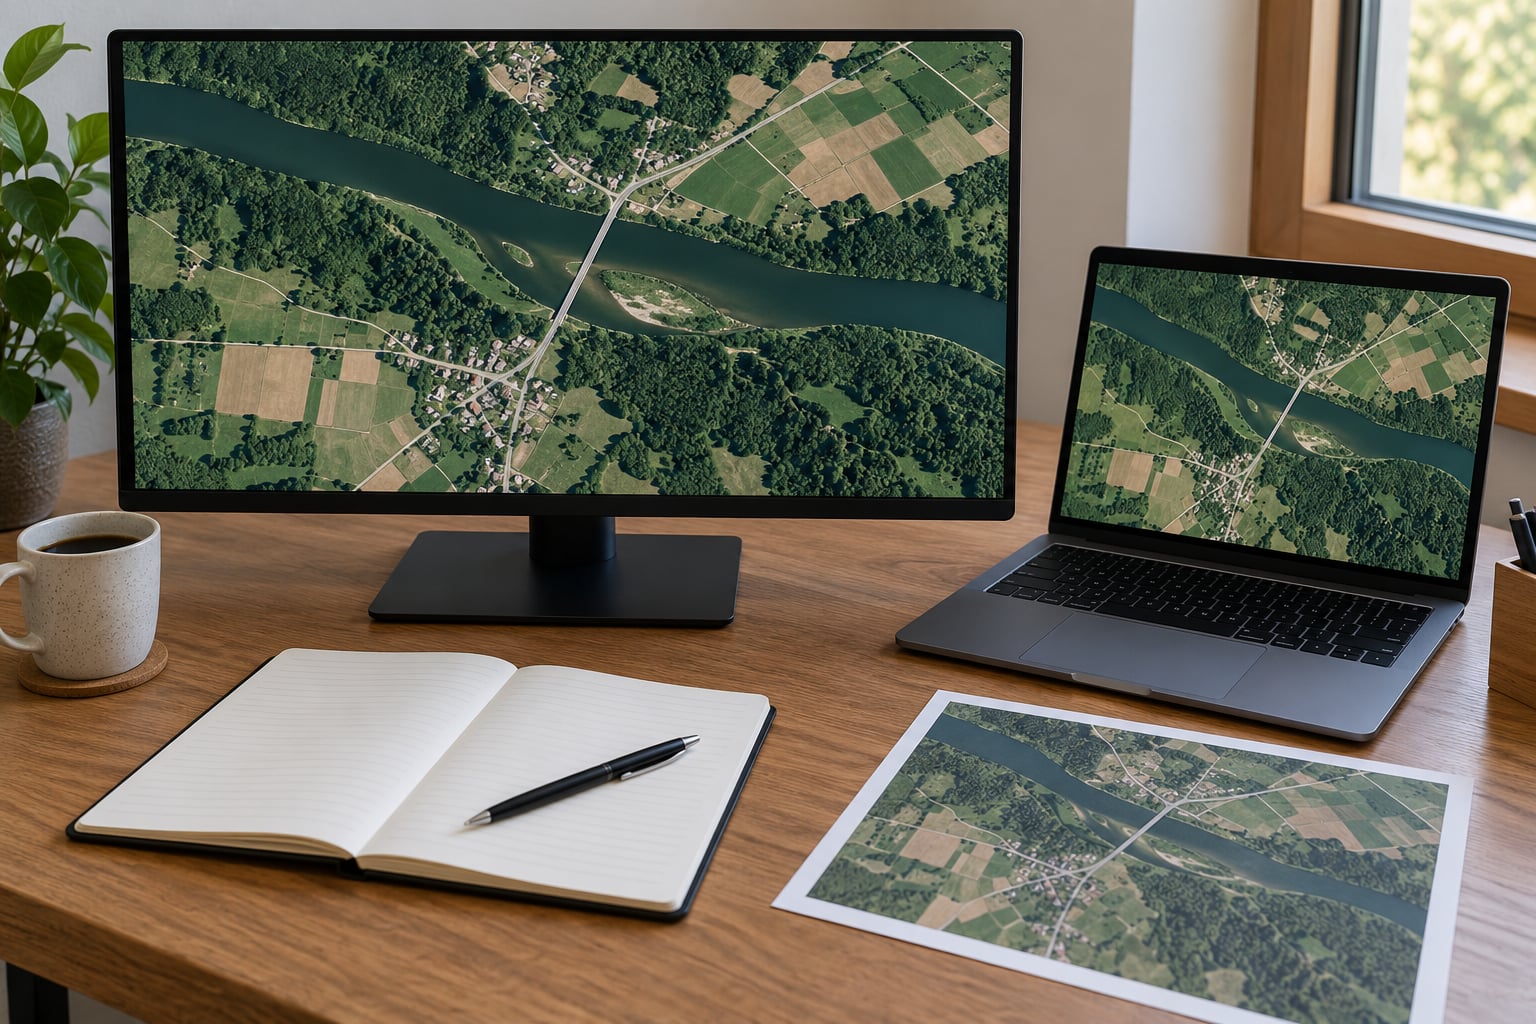
Analyzing satellite images for a story means treating an overhead picture as evidence, not decoration. You define the claim in testable terms, pull dated captures from an archive rather than the default view, pin down fixed reference points, measure what changed, cross-check it on a second platform, and document every step so a colleague can repeat your work and reach the same image on the same date.
That workflow is the whole job. The hard part is not opening the software, it is resisting the moment when a shape in the image looks like the thing you were hoping to find.
Table of Contents
- What You Need
- Step-by-Step: How to Analyze Satellite Images for a Story
- Common Mistakes
- Frequently Asked Questions
- Can satellite images prove that an event happened?
- What is the best free software for analyzing satellite images?
- How can journalists tell whether a visible change is real or just seasonal?
- How do you compare satellite images from different dates?
- Do satellite images show the exact time an event occurred?
- How should a newsroom verify satellite imagery before publishing?
- Conclusion
What You Need
Free tools will take you further than most reporters expect. Google Earth Pro and its web version give you a historical archive with a time slider, measurement tools and Street View dates. Sentinel Hub’s EO Browser delivers free Sentinel and Landsat imagery in any band combination. Planet Labs offers low-resolution daily mosaics through its education program, and Global Forest Watch tracks tree cover loss at a click.
Paid options matter when you need more detail or a capture from a specific day. Commercial providers such as Maxar, Planet and SkyWatch sell higher-resolution imagery, and aggregators let you order a defined area rather than buying a whole archive. The trade-off is cost and minimum order size, which is often the reason a small investigation stalls.
Beyond the software, you need a way to record what you did. A running evidence log with the source, acquisition date, coordinates and processing notes costs nothing and is the difference between a finding and an opinion. Amnesty International’s Evidence Lab and the GIJN Academy material on satellite investigations both treat that documentation step as non-negotiable, and so should you.
Step-by-Step: How to Analyze Satellite Images for a Story
Define the reporting question and choose the right imagery
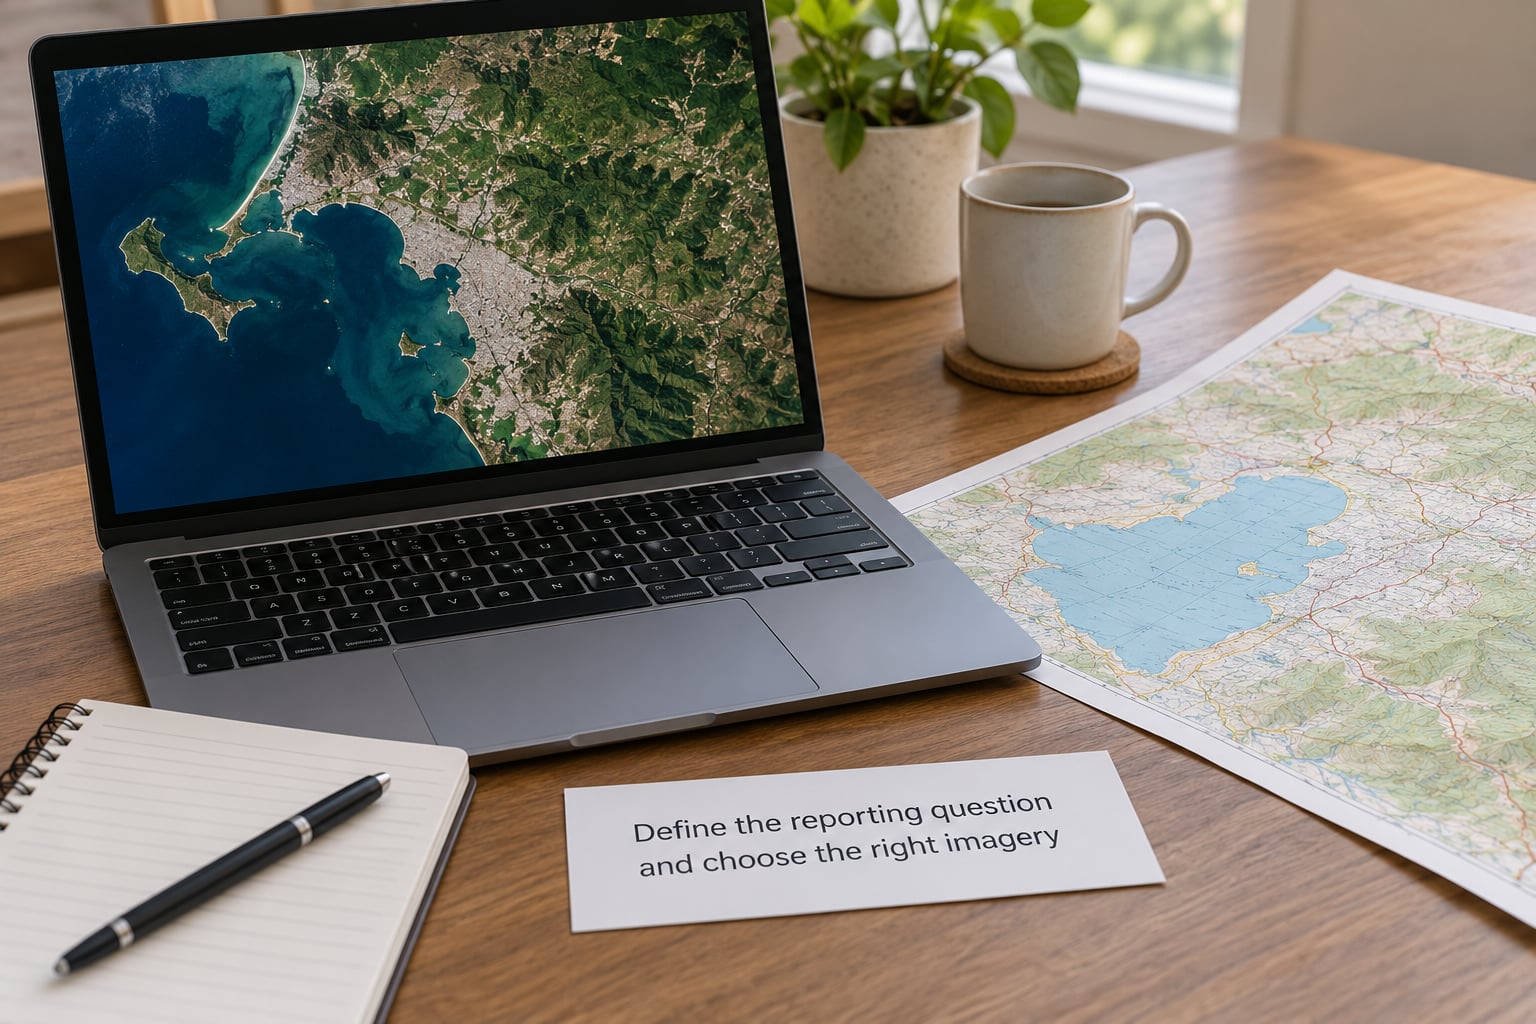
Write the claim as a falsifiable statement before you open any map. “A new factory was built near the border” is not testable; “at least 40,000 square metres of roof appeared within a two-kilometre box between March and August” is. The second version tells you what resolution you need and which dates to pull.
Then get the imagery right. You want the archive, not the default current image, because the current view is just one capture among thousands and it hides the comparison. Record the sensor, the acquisition date and time, the processing level and the exact bounds of the area the moment the image loads.
Inspect the image using multiple bands
A true-colour composite shows the world roughly as a camera would see it from a plane. That is where you start, and it is often enough: roads, roofs, fence lines, cleared ground and vehicle tracks are all legible in visible light at good resolution.
Other bands answer different questions, and the terminology trips almost everyone up at the start.
- Visible light (red, green, blue) matches human sight. Good for built structures, roads and bare earth.
- Near infrared is where vegetation glows bright. Healthy plants reflect strongly, stressed or burned ground stays dark, so a patch that looks ordinary in true colour can stand out sharply here. Amnesty’s Evidence Lab recommends pulling the near-infrared band specifically to catch fire damage.
- Shortwave infrared highlights moisture differences and helps separate cloud, snow and bare rock that look alike in visible light.
- Radar, or SAR sees through cloud and works at night. It looks grainier and less familiar, and interpreting it takes real practice, but it is the only option when an event happens under overcast skies.
Rotate the image before judging it. Amnesty analysts recommend it specifically because orientation bias makes humans under-read features that sit at an unusual angle. Most free viewers offer a rotate control.
Compare images across dates
Alignment matters first. Confirm that the two captures cover the same ground at the same scale, and if they were recorded from different viewing angles, expect buildings to lean and tree lines to shift. A large off-nadir angle can push apparent offsets of several metres out of a tall structure.
Season is the next trap. Vegetation, water levels, snow cover and even shadows change on a schedule you did not choose. Amnesty’s Sudan example is the one worth remembering: an area that looks burned may burn every year for agricultural clearing, so a scar means little without context.
Resolution and cloud cover complete the checklist. Comparing a 30-metre image against a 3-metre one tells you about the satellites, not the ground, and a scene with scattered cloud is worse than useless because the gaps invite pattern completion.
Measure and document the change
Switch on the scale bar before you draw any conclusion. Most tools let you measure distance and area directly, and a change described as “roughly the size of a football pitch” is a claim nobody can check.
Count deliberately rather than by impression. Project OSINT’s guidance is to anchor on at least three fixed reference points that do not change between dates, a road junction, a permanent building corner, a water tower. If the reference points register but the feature you care about appears between them, the change is real in the imagery. If the reference points do not line up, you have a registration problem, not a story.
Write down every capture as you go: source, acquisition date, coordinates, resolution, band combination, any processing applied. Save annotated screenshots with the same information visible. A finding you cannot reproduce is an anecdote.
Corroborate the visual finding
Imagery is one input, not the whole case. Corroborate before you write, not after you have found a picture you like.
Pull weather records for the location and date to confirm the cloud cover on the day of capture. Check official statements from the relevant authority, military, company or ministry, and read what they deny, if anything. Look for ground reports from local journalists, rescue workers or humanitarian organisations, since people on the ground can explain what a change means that pixels cannot. Then confirm the feature on a second platform or with a second provider, because independent sensors disagree about what they can see and one cloudy capture proves very little.
If ground reports are impossible, say so in the story. “This imagery shows the structure from above; we were unable to confirm what it is” is honest and publishable. A certainty you cannot support is not.
Write and present the story responsibly
Separate what you saw from what you concluded. The image shows a rectangular clearing with a new access road. Whether it is a military site, a factory or a logistics depot is inference, and the two need to read differently in the copy.
Include a short methodology box. Name the sensor, the dates, the processing you applied and what you could not determine. Reuters’ visual verification team runs the same discipline on video, and readers who understand the method trust the finding more.
Annotate before you illustrate. A north arrow, a scale bar and two or three labelled reference points turn a decorative overhead view into something a reader can actually interpret. Avoid publishing imagery of displacement camps, informal settlements or military sites without thinking about the people in frame, since precise locations can expose them.
Common Mistakes
- Reading colour without the band name. Vegetation looks pink or bright red in a false-colour composite and someone downstream will describe it as fire damage. Fix: state the band combination in the caption, always.
- Comparing across seasons. A field greening in April and browning in July registers as change. Fix: match the season, or pick a pair of dates close enough that growth cannot explain the difference.
- Trusting a cloudy or low-resolution capture. At 30 metres a single pixel covers a building. Fix: check the resolution against the size of the thing you are claiming, and move on if the numbers do not work.
- Treating correlation as causation. New buildings near a border do not prove troop movement. Fix: write “coincides with” until an independent source establishes purpose.
- Overstating a single image. One capture shows a state, not a process. Fix: publish only what the before-and-after pair supports, and describe motion as a possibility rather than a fact.
- Failing to sanity-check the picture itself. Composited and manipulated overhead images circulate. Fix: look for mismatched shadow directions, mismatched resolution across a seam, suspiciously straight edges and repeating textures.
One more habit pays off: zoom out. Zooming in shows detail and hides the pattern, and pattern recognition at the wrong scale is how reporters end up describing noise.
Frequently Asked Questions
Can satellite images prove that an event happened?
They can prove that a change is visible on the ground at a specific time, but they rarely prove what caused it or who did it. Imagery shows surfaces and their change over time. Who acted, and why, comes from ground reports, official statements and other evidence. Treat an image as strong support for the fact of a change and weak support for its cause.
What is the best free software for analyzing satellite images?
For a beginner, Google Earth Pro is the fastest start because its historical time slider and measurement tools require no account. Sentinel Hub’s EO Browser is better once you want specific band combinations, and it is free. Global Forest Watch covers tree cover loss specifically. Each has a real limit: archives, resolution or analysis tools.
How can journalists tell whether a visible change is real or just seasonal?
Anchor on at least three features that do not change between the two dates, such as a road junction or a permanent building corner. If those register correctly and the feature you care about appears between them, the change is real in the imagery. Then rule out season by comparing with imagery from the same period in other years, and check what local sources say about normal annual practice.
How do you compare satellite images from different dates?
Use the same viewer, zoom to a matching scale, and confirm three fixed reference points align before you read anything into differences. Watch for off-nadir angle shifts, which move tall structures sideways, and for differences in resolution or season. Record both acquisition dates and any processing, and export both frames at the same size for the story.
Do satellite images show the exact time an event occurred?
No. You get the acquisition time of a single pass over a location, and a sensor revisits the same spot on its own schedule rather than continuously. A change appears between two captures, so the event happened somewhere in that window, which can be days wide. Radar imagery works at night, but the timing limits are the same.
How should a newsroom verify satellite imagery before publishing?
Require a second independent source for the core claim, either a different platform or ground reporting. Check the imagery metadata and cross-reference weather records for the capture date. Have an editor confirm that the written claim matches what the image supports, with observation and inference kept apart. Publish the methodology so readers can repeat the work.
Conclusion
Four things to do first. Write the claim in a form that could be proved wrong. Keep the original, unmodified capture and its acquisition date. Compare against a date you chose before you looked, matched for season and scale. And corroborate every published assertion with a source that is not the satellite.
Done properly, satellite imagery gives you documented, timestamped proof of conditions somewhere you may never be able to travel. That is a genuine reporting advantage, and it lasts only as long as your evidence chain does.