
Census data can tell you how many people live somewhere, how they work, what they earn, what they pay for housing and how they got to work, down to a level most local coverage never reaches. What it cannot do is count to the last person: the decennial Census counts every household every ten years, while the American Community Survey runs a rolling sample and publishes every figure as an estimate with a margin of error attached. Knowing how to interpret census data for local stories is mostly the discipline of quoting an estimate honestly, matching the geography to the question, and refusing to call a small movement a trend.
None of this needs a statistics degree. It needs about an hour of setup and a repeatable six-step workflow, which is what follows.
Table of Contents
- What You Need Before You Pull a Single Number
- Step-by-Step: How to Interpret Census Data for Local Stories
- Common Mistakes That Get Census Stories Corrected
- Frequently Asked Questions
- What is a margin of error in census data?
- Should I use American Community Survey data or decennial census data?
- When are two census estimates statistically different?
- How do I compare census data across different geographic boundaries?
- What is the best way to show census data on a map?
- How can I make a local census story more accurate?
- Conclusion
What You Need Before You Pull a Single Number
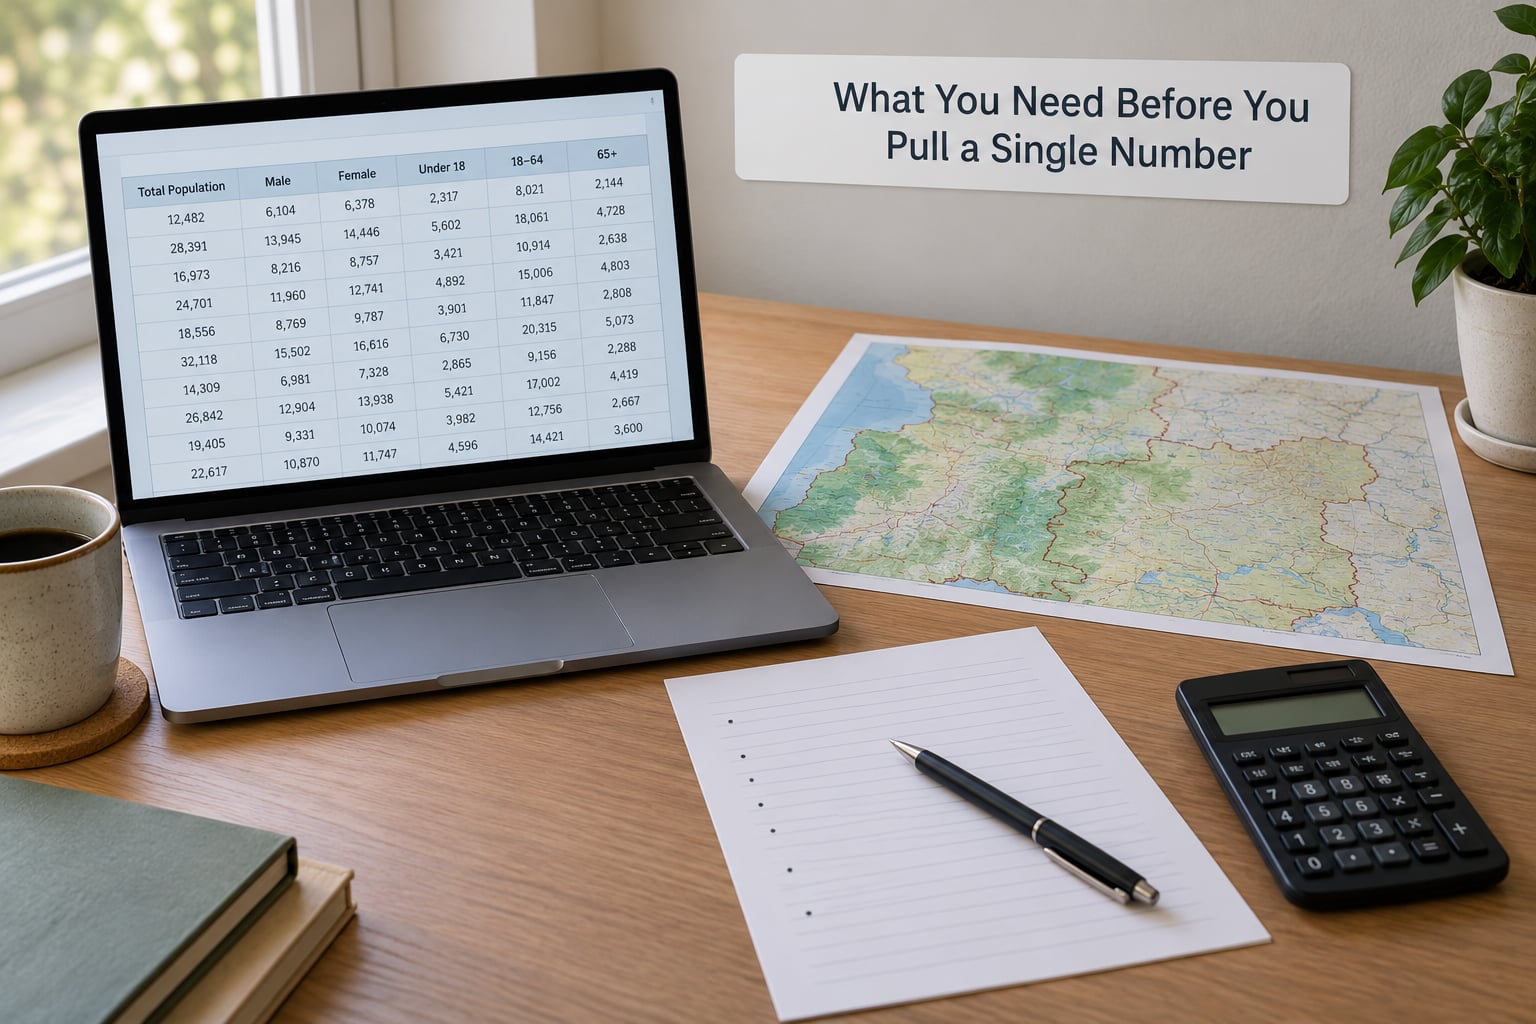
Six things have to be settled before a number is worth quoting, and three of them are not on the face of the chart.
- The release and vintage. Which survey, and which years of collection does it cover? A 2023 ACS 5-year estimate pools samples from 2019 through 2023. It is not a snapshot of 2023.
- The geography. State, county, incorporated place, census tract, block group or ZCTA. Each covers different people, and they do not nest cleanly.
- The table and the variable. Table B19013 and table S1901 both carry income. They are not interchangeable, and neither is the profile page that mixes both.
- The universe. People, households, families, occupied housing stock, or households with a specific characteristic. Denominators decide what your percentage means.
- The comparison period. Any change claim needs a stated starting point and a stated end point.
- The margin of error. Published alongside every ACS estimate, and hidden behind a tooltip on data.census.gov more often than not.
On tools: data.census.gov is the source of record and the only place with every table. Census Reporter gives you a place profile already assembled and a map, and it is the fastest route to a first draft. The Census API returns JSON for anything you plan to repeat, chart or update. Downloadable files from the Census FTP-style directories are the fallback when a table needs to be rebuilt offline.
Step-by-Step: How to Interpret Census Data for Local Stories
1. Choose the Right Dataset and Geography
Match the data product to the size of the place and the freshness you need. The decennial Census gives a complete count but refreshes only every ten years; the ACS gives annual estimates with uncertainty attached.
| Data product | Population threshold | Best use | Main trap |
|---|---|---|---|
| Decennial Census | All addresses, every 10 years | Population counts, redistricting, small-area counts | Ten-year-old data described in the present tense |
| ACS 1-year estimates | 65,000 or more | Recent annual conditions in a large city or county | None available for anything smaller |
| ACS 5-year estimates | No minimum | Tracts, block groups, rural counties, small towns | Wider margins of error, overlapping samples between vintages |
| Economic Census | Employer and establishment counts | Business counts and employment by industry | Counts establishments, not people |
Now the geography, which is where more fabricated change gets born than anywhere else. A census tract holds roughly 1,200 to 8,000 people and is redrawn between vintages, so tract 401.2 in one vintage and tract 401.2 in the next can describe different neighborhoods. A ZCTA is a postal delivery area and does not follow city limits at all. A place is an incorporated city or town, which means an unincorporated neighborhood may have no place-level data whatsoever.
Never mix levels inside one comparison. A city-to-ZCTA swap will move your numbers even if not a single resident changed address.
2. Read the Table and Variable Definitions
Every ACS table carries a universe in its column heading, and that phrase decides what your number counts.
Table B19013, median household income, counts households. Table S1901, the same subject in a subject table, counts households and gives you both the estimate and its margin of error, grouped by tenure and race. Table B19301 counts people below the poverty line using the Census Bureau definition, which is not the same threshold many local officials quote from a different program.
Read the footnotes before you write the sentence. They flag things like a universe that includes group quarters residents, a suppressed cell where disclosure avoidance kicked in, or a table where the margin of error is not available. A value of zero with a large margin of error means nobody was observed, not that nobody exists.
3. Calculate Rates Instead of Reporting Raw Counts
Raw counts make small communities look more important than large ones. Convert to a rate or a share before comparing places.
Share: part divided by the relevant total, times 100. Households paying 30 percent or more of income on housing costs, divided by all households.
Rate per 1,000 or 100,000: the standard form for events, rare conditions and anything where you will compare across areas. Keep the denominator visible in the sentence or the graphic.
Per capita: an amount divided by population. The number is only as honest as the population estimate in the denominator.
A worked case. Town A has 400 cost-burdened households out of 1,200 households, which is 33 percent. Town B has 900 out of 6,000, which is 15 percent. Town A has fewer burdened households in absolute terms and more than twice the share. The share belongs in the lead; the raw count belongs in the second paragraph if it matters at all.
4. Check Margins of Error and Statistical Significance
A margin of error is the plus-or-minus figure Census Bureau publishes for an ACS estimate at 90 percent confidence. Read it as: if the sampling had been redone many times, roughly 9 out of 10 results would fall within that range.
Two practical rules. First, never quote more precision than the margin supports. An estimate of 47,216 with a margin of 900 becomes 47,000 in copy, and 47,200 becomes false precision sitting next to a real uncertainty range. Second, when comparing two estimates, do not eyeball the margins.
The test for whether two ACS estimates are statistically different: add the two margins of error. If the difference between the estimates is larger than that sum, the difference is statistically significant at roughly 90 percent confidence. If the intervals overlap, you do not have a finding.
Applied to a real pattern: County A poverty estimate 14.2 percent, margin 1.1. County B poverty estimate 15.4 percent, margin 0.8. The estimates differ by 1.2 points and the margins sum to 1.9. The intervals overlap, so “County B has higher poverty than County A” is not supported, and running it as a finding is how a story gets corrected.
The other half of the discipline is disclosure. Recent ACS releases carry documented nonresponse bias following pandemic-era collection disruption, which the published margin of error does not capture. Practitioners on r/USCensus2020 and the PRB ACS Data Users Group flag this repeatedly, and it belongs in a methodology note when you publish small-area figures.
5. Compare Changes Without Mixing Incompatible Measures
Year-over-year change is where census stories go wrong most often, because two independent problems hide inside one calculation.
Consecutive ACS 5-year vintages overlap. The 2019-2023 sample and the 2018-2022 sample share four years of respondents, so the two estimates are correlated and a naive significance test overstates the evidence. Practitioners ask about this constantly on data forums, and the honest answer is to compare non-overlapping periods, or to use a decennial-to-ACS comparison and say so plainly.
Second, definitions drift. A questionnaire change, a revised income bracket, a new universe or a redrawn tract can all produce movement with no real-world cause behind it. Check the Census Bureau release notes for the vintage, and check whether the boundaries covering your area were redrawn.
| Geography | Typical population | Use it for | Common trap |
|---|---|---|---|
| State | Millions | Statewide trend, comparison across states | Too coarse for a local story |
| County | Tens of thousands | Regional conditions, service delivery | Rural counties get wide margins of error |
| Place | Varies widely | City-level reporting | Excludes unincorporated area entirely |
| Census tract | 1,200 to 8,000 | Neighborhood and block-group style reporting | Boundaries redrawn between vintages |
| Block group | 600 to 3,000 | Fine-grained analysis | Margins of error wide enough to swallow findings |
| ZCTA | Varies widely | Postal-area audience views | Not a geographic or municipal area |
6. Turn the Finding Into a Local Story
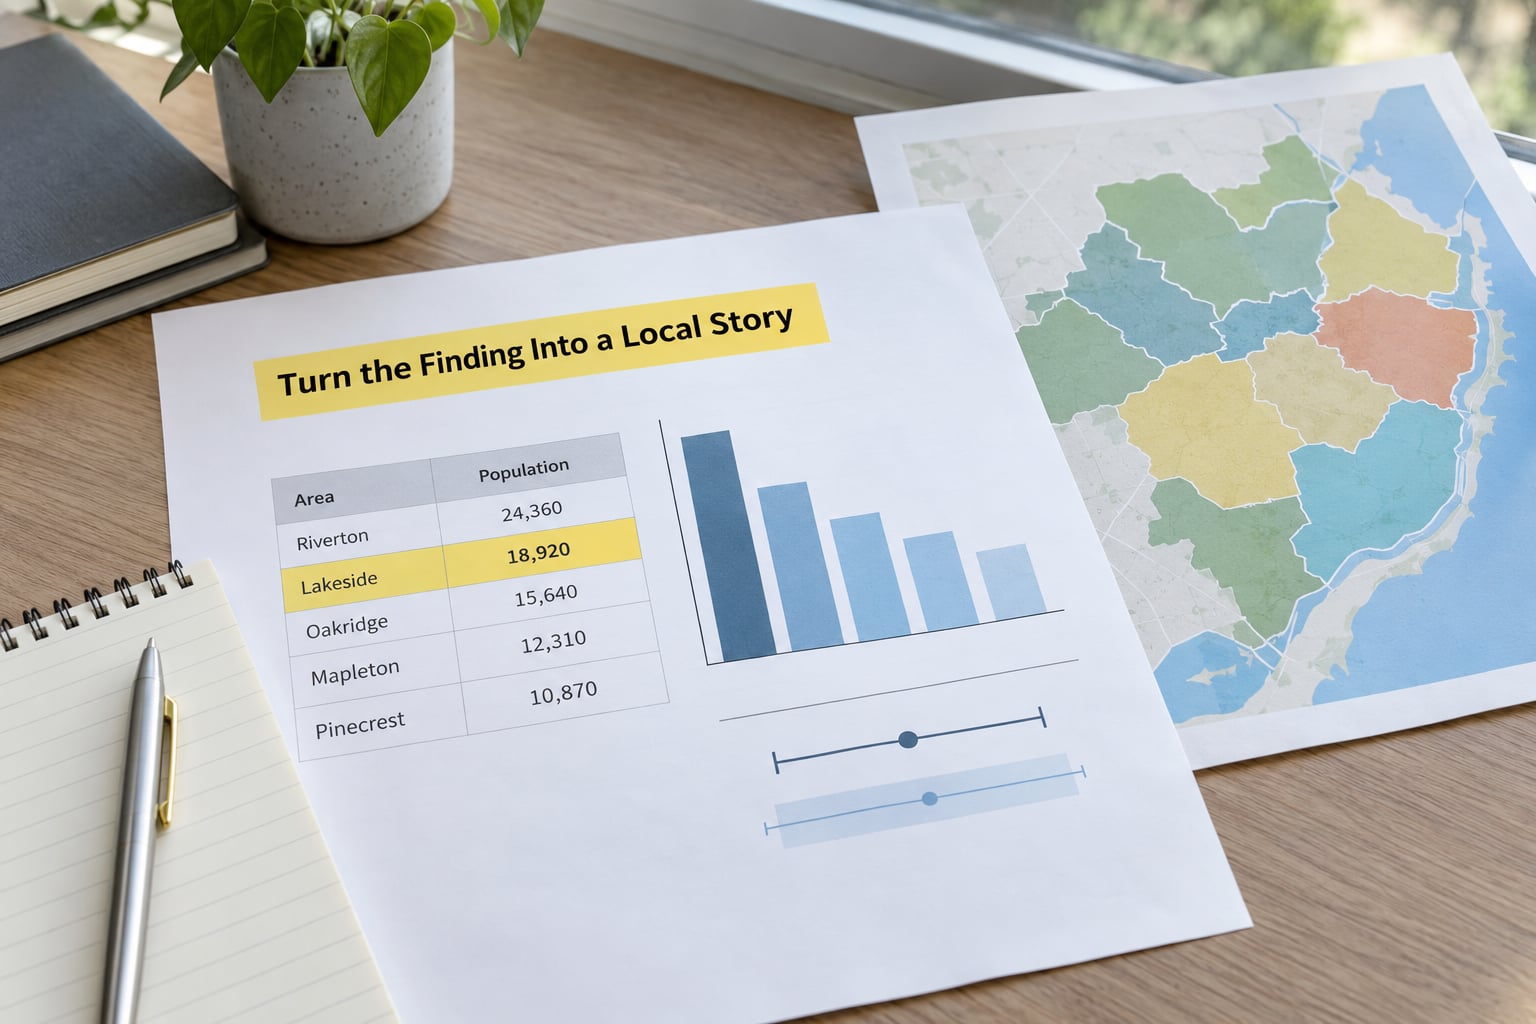
Every defensible census line carries six components: the finding, the denominator, the geography, the period, the uncertainty, and what it is being compared against. A sentence missing the last three is a claim; a sentence carrying all six is a story a reader can act on.
Sample: “Roughly one in three renter households in Marlow spent 30 percent or more of their income on housing, about 33 percent, according to the Census Bureau’s 2019-2023 five-year American Community Survey estimates for the city, with a margin of error of plus or minus 4.1 points. The national renter share over the same period was about 31 percent.”
Angles that survive the margin of error test: a gap that has held across three non-overlapping periods, a level far enough from the national figure to clear the combined margins, or a shift large enough that the comparison period makes it unambiguous. Angles that do not: one unusual year in a rolling window, a difference between two neighboring tracts, and anything built on a block group.
If you use the Census API or data.census.gov for anything repeatable, log the table ID, the vintage and the geography codes in your notebook the day you pull them. Six months later you will not remember, and the reader cannot verify what you cannot point to.
Common Mistakes That Get Census Stories Corrected
- Treating an estimate as a count. The fix: round to the precision the margin supports and say it is an estimate.
- Percentage versus percentage point. A rate moving from 10 percent to 12 percent is a 2 percentage-point rise and a 20 percent relative rise. Never mix the two in one sentence.
- Wrong denominator. “Half of residents” and “half of households” are different claims with different numerators.
- Comparing incompatible geographies. Switching between place, ZCTA and tract across periods manufactures change that residents never experienced.
- Overlapping samples treated as independent. Two adjacent 5-year vintages share respondents, which weakens any significance test run on them.
- Association written as causation. The census observes a neighborhood; it never explains why it looks that way.
- Too many digits per paragraph. A working house-style rule from IRE’s Numbers in the Newsroom is roughly eight significant digits per paragraph. Every digit past that is noise the reader has to trust blindly.
- Stating a change with no comparison period. An estimate alone is a level, not a trend.
Before publishing, four checks: the geography matches the sentence’s word for word, the vintage year is named, the margin of error is either reported or the claim has been re-tested for significance, and a reader could follow the table ID to the same number you used.
Frequently Asked Questions
What is a margin of error in census data?
A margin of error is the plus-or-minus figure the Census Bureau publishes with every American Community Survey estimate at 90 percent confidence. It reflects sampling error only, not nonresponse or coverage problems. Practically, it tells you the range within which the true value probably sits, and it should determine how many digits you report. It does not describe the accuracy of decennial Census counts, which are complete enumerations.
Should I use American Community Survey data or decennial census data?
Use the decennial Census for population counts, redistricting and anything needing a small-area count. Use the ACS for current income, poverty, housing, education, commute and health coverage data, because the last decennial count is a decade old. For a place of 65,000 people or more, the 1-year ACS gives the most recent annual estimate. Below that threshold, or at tract and block-group level, the 5-year ACS is the only option.
When are two census estimates statistically different?
Add the two margins of error. If the gap between the estimates is larger than that sum, the difference is statistically significant at roughly 90 percent confidence. If the intervals overlap, the movement is within sampling noise and should not be reported as a finding. For adjacent ACS 5-year vintages, be more cautious still, because overlapping samples mean the simple test overstates the evidence.
How do I compare census data across different geographic boundaries?
Use one geography level consistently and check whether boundaries changed between vintages. Census tracts are redrawn between decennial cycles, so the same tract number can describe different people. For a place, stay inside incorporated city limits; an unincorporated area may not appear in place-level tables at all. If you must switch levels, recompute both sides of the comparison on the same geography.
What is the best way to show census data on a map?
Color by rate rather than raw count, choose a shaded scale rather than a graduated one so readers do not read one hue as much bigger than another, and show more than one year so the map cannot be mistaken for a snapshot. Use tracts or ZIP codes rather than state outlines for local stories. Label the map with the vintage year, and say in the caption that each area carries its own margin of error.
How can I make a local census story more accurate?
Name the table, the vintage year, the geography and the estimate type in the story itself rather than in a footnote. Round to the precision the margin of error supports. Test every change claim with the combined-margin rule before you write it. Publish the Census Bureau table ID so readers can reproduce your number, and add a short methodology note naming the sample years behind a five-year estimate.
Conclusion
Start by pinning down five things before a single number reaches your draft: the exact table, the geography, the universe, the sample period, and the margin of error. That takes about five minutes on data.census.gov and it prevents nearly every correction described above.
Everything else is habit. Round to what the data supports, test changes with the combined-margin rule, name the vintage year in the story rather than the footnote, and keep the table ID where a reader can find it. Census data for local stories is only as good as the care taken between the download and the sentence.