Checking the method before the number is how to read a poll like a journalist. Who ran it, who paid for it, who was actually sampled, how the question was worded, and how much uncertainty sits around the result. A headline that says one candidate leads by four points tells you almost nothing until you have the topline, the field dates and the sample size. The full audit takes about ten minutes, and in 2026 there is no excuse for publishing a political number without it.
What You Need
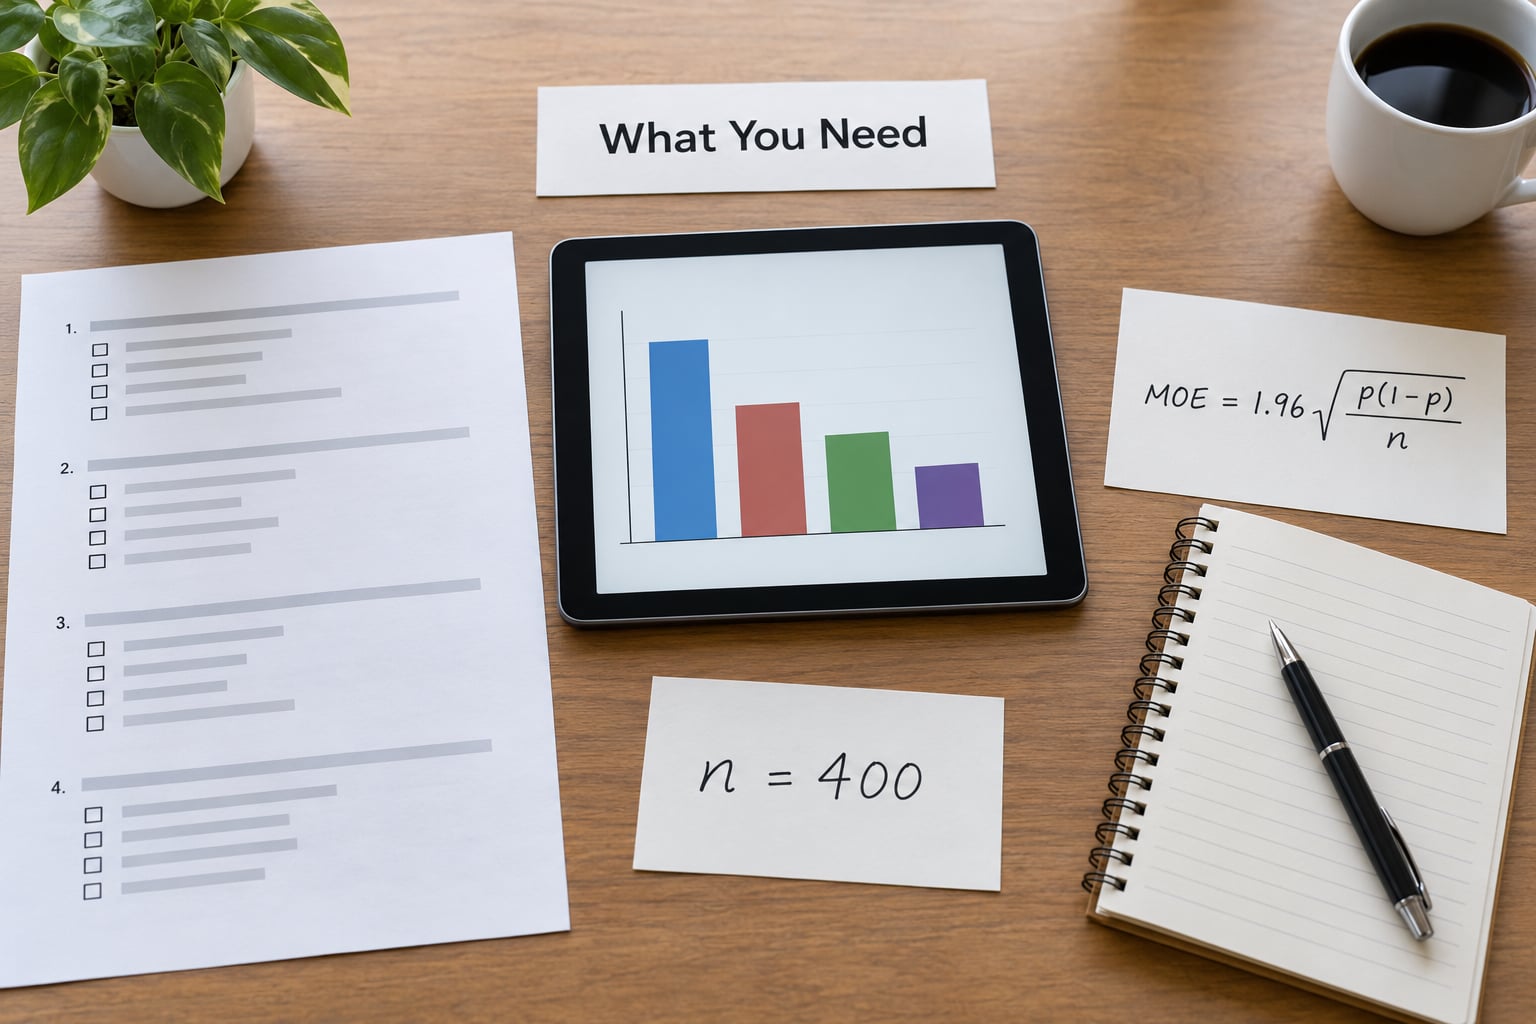
A poll is only as readable as the paperwork behind it. Before you evaluate anything, get hold of the primary source rather than the news graphic someone else built from it.
- The full questionnaire, including the order questions were asked in, not a summary of the headline question.
- Sponsor and pollster, named separately. The organization that paid and the organization that fielded the work are often two different names.
- Field dates, stated as a range. Polling that straddles a debate, a court ruling or an indictment measures two different electorates.
- Target population: all adults, registered voters, or likely voters, plus the geography covered.
- Sample size, universe and methodology, including mode of interview, weighting variables and exclusions.
- Margin of error and confidence level, as reported by the pollster rather than calculated by a headline writer.
- The topline PDF and crosstabs if the pollster releases them, plus any independent verification or second-party scoring.
If a release arrives without the methodology section, that is itself a finding, and reporters on the National Press Foundation’s tips page treat it as one. The advice there is blunt: getting a poll handed to you is not a reason to write about it. Ask the pollster directly for the missing items, and if the sponsor declines, that non-answer belongs in the story.
Step-by-Step: How to Read a Poll Like a Journalist
1. Identify Who Commissioned the Poll
Start with the sponsor, because whoever paid has an interest in the number existing. Campaigns, parties, advocacy organizations, trade groups and commercial clients all commission polling, and each has a reason to frame the result in a particular way.
Independent does not mean neutral. A pollster can be methodologically careful and still be working for a client with a stake in the outcome. What you are checking is narrower and more useful: is the fielding organization named, is the sponsor disclosed, and is the questionnaire published in full?
Selective release is the tell. A campaign that publishes only the flattering question, or one favorable week out of a twelve-week field period, has made a choice about what you get to see. Releasing the full topline, including the undecideds and the unfavorable questions, is the green signal. Users on r/changemyview and elsewhere are blunt about the alternative: an undisclosed sponsor is treated as a reason for suspicion rather than a footnote.
2. Check the Population and Sample
The stated population must match the people actually reached. Ask who was eligible, who was contacted, and who answered, because those three groups are never identical.
Coverage error and nonresponse are where polls actually fail, not small sample size. r/AskStatistics threads make this point repeatedly: a sample smaller than the population is normal and fine, while a sample assembled by self-selection or with no response-rate reporting is a structural problem no margin of error can repair.
Geography matters just as much. A poll of four battleground states is not a national poll, and a poll of voters in one metro area is not a state poll, whatever the topline says.
| Universe | Who counts | What to watch |
|---|---|---|
| Adult population | Everyone 18 and over in the covered geography | Includes non-voters; a good benchmark for opinion, a poor one for elections |
| Registered voters | Anyone on the voter file who has registered | Includes people who will not vote in a low-turnout race, which inflates the other side |
| Likely voters | A modeled subset of registered voters | The model is an assumption; always ask which inputs it uses, such as past turnout and vote history |
Then check who is missing. Cell-only households, people with less formal education, younger voters and Black and Hispanic voters are the groups pollsters consistently report trouble reaching. Ask what the pollster did about it, such as oversampling a group or adjusting the weights, and how large those adjustments got. A weight of 1.8 is a small correction. A weight of 4.0 is a confession.
3. Read the Exact Question and Response Options
Read the question out loud, exactly as printed, including the order and every response option offered. Wording alone can move a result several points.
Consider two versions. “The proposed tax increase would fund road repairs in the county” invites a yes by framing what the money does. “Do you support or oppose the proposed tax increase?” is neutral on the same policy. Neither is inherently wrong, but only the second tells you what respondents were actually weighing.
Four things to scan for: double-barreled items that ask about two things at once, missing options that force a preference a person does not hold, unbalanced scales where the first option always gets read first, and loaded or vague timeframes such as “in the foreseeable future.” If the pollster will not release the wording, the result cannot be evaluated, and a characterization of it in your story should say so.
4. Examine the Sample Size and Margin of Error
Sample size sets the size of the random error, and the margin of error is the width of the range around a point estimate at a stated confidence level, usually 95 percent. It is not the percentage of results that are wrong.
The arithmetic is simple enough to do in your head. For a proportion near 50 percent, which is the worst case and the most common in a two-option race, the margin of error is roughly 1.96 divided by the square root of the sample size, expressed as a percentage.
| Sample size | Approximate margin of error at 95 percent |
|---|---|
| 100 | plus or minus 9.8 points |
| 400 | plus or minus 4.9 points |
| 800 | plus or minus 3.5 points |
| 1,000 | plus or minus 3.1 points |
| 2,000 | plus or minus 2.2 points |
| 10,000 | plus or minus 2.0 points |
Now convert the result into a range instead of a headline. A poll showing 51 percent plus or minus 3 is not a fact about 51 percent of people; it is a statement that the true value sits somewhere around 48 to 54. A 48 percent result is fully consistent with the poll, and a Reddit thread on r/explainlikeimfive asking why pollsters do not simply publish ranges gets asked often enough that the answer belongs in the story.
Then ask whether the lead is real. The quotable rule: a lead smaller than the margin of error is a tie, and even a lead of twice the margin of error deserves a hedge. Weighting also inflates the real error, so a weighted 800-person sample behaves more like a 500-person sample, and pollsters who account for this correctly will say so.
5. Review the Methodology and Weighting
The methodology section is where the real information lives. Look for the sampling method, the mode of interview, the field dates, the response rate, the weighting variables, the exclusions, and how undecided respondents were treated.
Mode shapes who answers. Landline-only polling misses cell-only households outright, which is why it is no longer acceptable on its own. Interactive voice response and automated dialing can be efficient or dreadful depending on the screener, and the National Press Foundation calls robo-polls a thin sheet of ice. Opt-in online panels are cheap and fast but non-probability samples, where the statistician cannot honestly attach a margin of error at all.
Weighting is a repair tool, not a magic one. Weighting to education or race can correct a large imbalance, but it cannot invent opinions for people who never answered, and it cannot undo a question that was worded badly. Large adjustments should always be reported.
The red line is honesty about the whole chain. A pollster who releases the full AAPOR disclosure set, publishes the topline and crosstabs, and has a public track record is giving you enough to work with. One who releases a graphic and a single number is asking to be quoted rather than checked.
6. Compare the Result with Other Evidence
One poll is a snapshot, not a forecast. It estimates what a population would have said during a specific window, and it says nothing about turnout on a specific day.
Place it in context before you write. Compare it with the same pollster’s previous waves, which is the cleanest trend line available because the methodology has not changed. Compare it with a polling average, which smooths individual outliers and is a better summary than any single number. Then compare it with official statistics, past election results and other reputable polls on the identical question.
Two credible polls can differ by five points and neither is lying. The sources of the gap are ordinary: a small margin of error on each, different field dates, different modes, different universes, and different weighting targets. Reddit users lose a lot of energy to the assumption that a discrepancy means deception, and the honest answer is that disagreement within the margin is the normal condition of survey research, not evidence of fraud. Investigate a gap by comparing methods first and motives second.
7. Report the Limits, Not Just the Lead Number
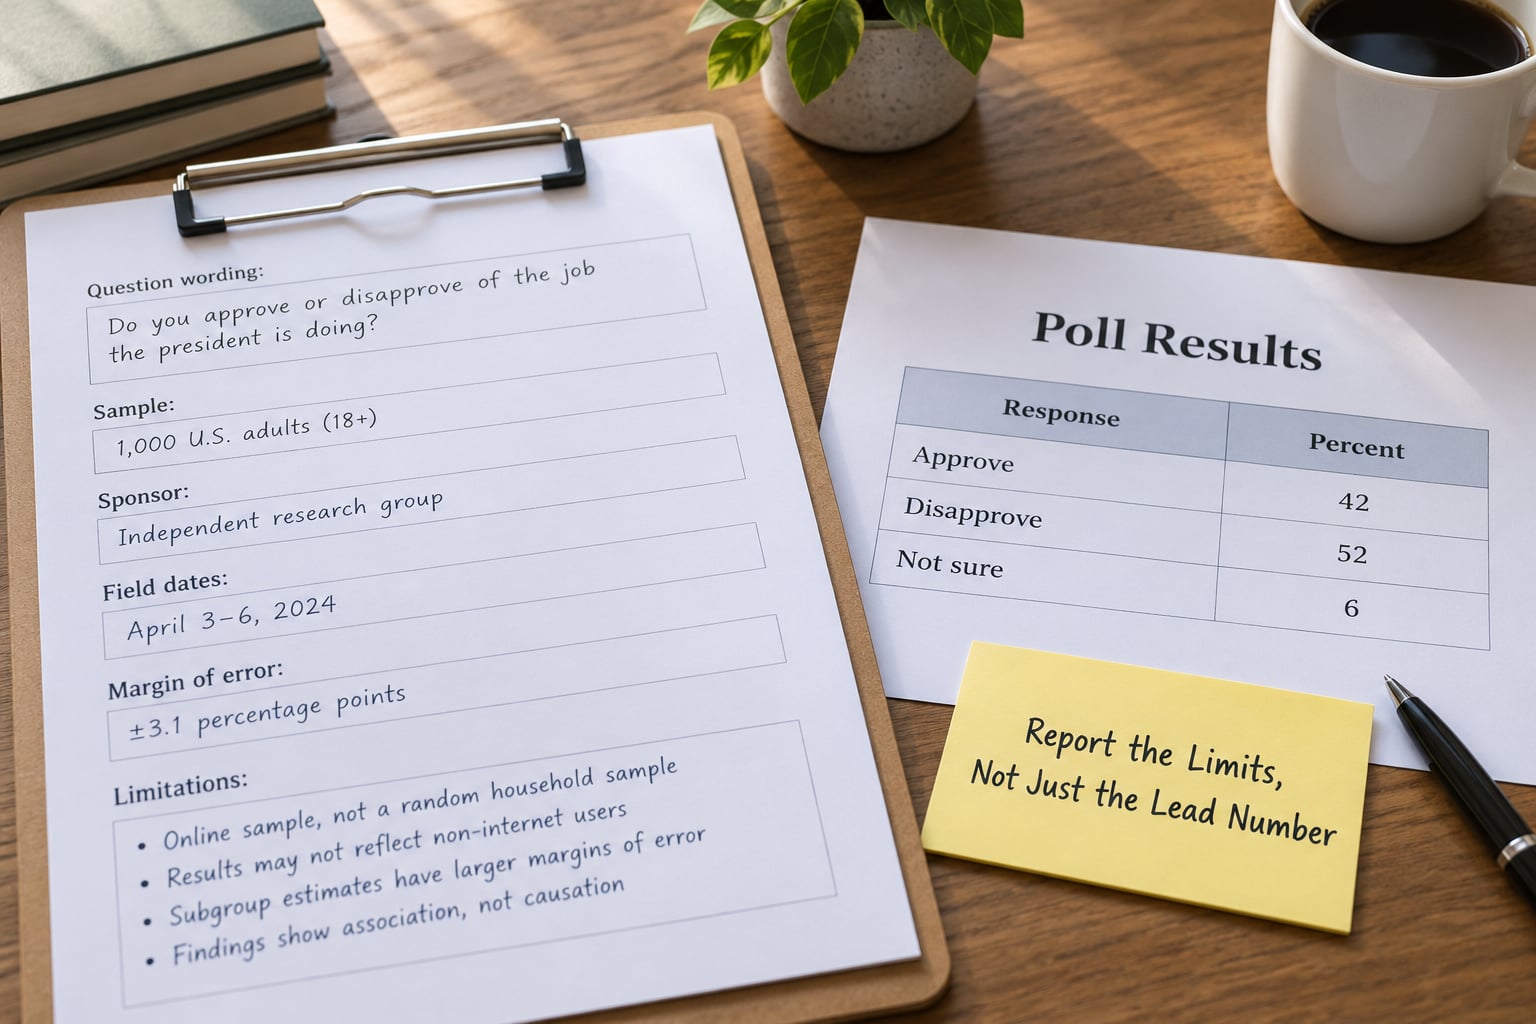
The finished story carries the finding and the caveats in the same breath, not in a buried footnote. A reusable template covers ten fields.
- The finding, stated as a range rather than a single number.
- The exact question wording.
- The sponsor and the pollster, named separately.
- The universe: adults, registered or likely voters.
- Sample size and unweighted base.
- Field dates and mode of interview.
- Margin of error and confidence level.
- Notable methodological limits, in plain language.
- A link to the original release.
- What was asked of the pollster that they did not answer.
You also need a rule for when not to write the story. If the lead sits inside the margin of error, if the release is a partisan internal poll with no topline, or if the only interesting number is a subgroup with a tiny base, the responsible call is to hold. Not every poll that lands in your inbox is a story.
The same discipline applies far from elections. Brand-sponsored and market-research polls follow the same rules, and readers should apply the identical checks: who commissioned it, who was sampled, how the question was worded, and what is being hidden by the choice of sample. Polls about products, customer satisfaction and workplace sentiment get read as objective more often than political ones do, and they carry the same hidden sponsor every time.
Common Mistakes
The most common errors in polling coverage are not statistical mistakes. They are reporting habits, and they are easy to fix once you have the table below in front of you.
| Red flag | Trustworthy signal |
|---|---|
| No methodology section | Full AAPOR-style disclosure released by the pollster |
| Undisclosed or self-selected sample presented as random | Named sampling frame and mode of interview |
| Hidden sponsor, or a sponsor that clearly benefits from the result | Sponsor and fielding organization named separately |
| Weighted results with no disclosure of what was weighted to | Weighting variables and adjustment sizes published |
| Point estimate with no range attached | Margin of error, confidence level and full topline published |
| A small subgroup number quoted as a headline | Subgroup base sizes shown next to the percentages |
| One favorable week released from a long field period | Complete topline across the whole field window |
Confusing percentage points with percent change. A poll moving from 42 to 48 is up six percentage points, and a 14 percent increase relative to the original figure. Writers mix these constantly, and readers cannot tell which one was meant.
Treating a poll as a vote forecast. A poll measures opinions during field dates. It does not model turnout, and it does not predict an outcome.
Ignoring question wording. If a poll never publishes the question, a result cannot be evaluated at all, and saying so is the accurate description.
Quoting subgroup numbers without the base size. This is the single most-asked question about polls on r/fivethirtyeight, where the consensus is that crosstabs are macro-level data carrying a much wider error than the topline. A crosstab that covers more than half the full sample is generally usable; smaller ones are not. A 9-point gap among a group of 80 respondents means that subgroup has a margin of error near 11 points, and the gap is noise.
Assuming a pollster’s reputation settles the question. People label pollsters as leaning left or right constantly, usually without a stated criterion. A better test is the pollster’s record on their own past polls: average absolute error across races, disclosed publicly, is a far more useful measure than a brand name.
Repeating a number you did not verify. The fix is procedural: open the original release, not the article about it, and confirm the number, the field dates and the margin of error before the sentence goes out.
Frequently Asked Questions
What is the margin of error in a poll?
The margin of error is the width of the range around a poll’s point estimate at a stated confidence level, usually 95 percent. A poll of 51 percent plus or minus 3 means the true value plausibly sits between 48 and 54. It measures random sampling error only, and it does not correct a biased sample, a leading question or undisclosed weighting.
How big a sample size does a poll need?
For a national two-option race, roughly 800 to 1,000 interviews is the practical floor, giving a margin of error near 3 points before weighting. That is enough to separate candidates who are genuinely far apart, and nowhere near enough to resolve a two-point difference. Below about 400, subgroup breakdowns become unusable for reporting.
What is a crosstab in polling?
A crosstab breaks a poll’s results down by a characteristic such as age, party identification or education, showing how each subgroup answered. The catch is sample size. A subgroup covering 10 percent of an 800-person sample has a base of 80 and a margin of error near 11 points, so small gaps inside a crosstab are noise and should not be reported as findings.
What is a likely voter poll versus a registered voter poll?
A registered voter poll surveys everyone on the voter file, including people unlikely to vote. A likely voter poll applies a model to estimate who will actually vote, using inputs such as past turnout and vote history. Likely voter models produce numbers closer to election results, but the model is an assumption the reader is entitled to see.
Why do two polls of the same question give different answers?
Different pollsters use different field dates, modes, universes and weighting targets, and each result carries its own margin of error. Two credible polls can differ by several points with nobody lying. Resolve the disagreement by comparing methods first, then by looking at a trend line within a single pollster rather than jumping between releases.
Conclusion
Learning how to read a poll like a journalist is a seven-step habit: identify the sponsor, check the population and sample, read the exact question, size the sample and margin of error, review the methodology and weighting, compare the result against other evidence, then report the limits alongside the number. Start with the original release, not the graphic, and turn every point estimate into a range before you write a word about it.
Responsible reporting keeps two things apart: what was measured, and what someone claims it means. The measurement is a snapshot of opinion during a few days, with uncertainty attached. Everything else is interpretation, and interpretation is where the errors get published.