Percent change is the difference between two values, divided by the original value, multiplied by 100. A positive result means the new value is higher than the original, a negative result means it is lower, and the original value always belongs in the denominator.
If you need to know how to calculate percent change correctly, the arithmetic takes about 30 seconds with a calculator and less than that in a spreadsheet. The hard part is rarely the math. It is picking the right baseline, keeping the values in the right order, and writing the result in copy in a way that cannot be misread.
Table of Contents
- What You Need
- Step-by-Step: How to Calculate Percent Change Correctly
- Frequently Asked Questions
- How do I calculate percent change in a spreadsheet?
- What is the formula for calculating a percentage decrease?
- Should I divide by the original value or the new value?
- How do I calculate percent change across multiple periods?
- What is the difference between percent change and percentage points?
- How should journalists round percent change results?
- Conclusion
What You Need
You need four things, and three of them are numbers you probably already have.
- Two values: the original (baseline) value and the new value.
- A direction: which value came first. Percent change is directional, so “from A to B” is not the same claim as “from B to A”.
- A calculator or spreadsheet: for the division and for the 100. Paper works fine for a story with two numbers.
- Context, optional but useful: the time period, the unit, and whether the underlying number is a count, a currency amount or a rate.
The baseline is simply the value the comparison starts from. For a newsroom metric it is usually the previous period or the same period last year, and the label matters more than most people expect: “up 15 percent from last quarter” and “up 15 percent from the same quarter last year” are different claims about the same arithmetic.
One warning before you start. If the original value is zero, percent change is undefined. There is no denominator to divide by, so a jump from 0 to 400 pageviews cannot be expressed as a percent increase, no matter what any calculator tells you. Report it as an absolute number instead.
Step-by-Step: How to Calculate Percent Change Correctly
1. Identify the original and new values
Write both values down before touching the calculator, and label them. That single habit prevents most errors.
Take a concrete case: a publication’s newsletter audience grows from 2,000 subscribers at the end of one quarter to 2,300 at the end of the next. The original value is 2,000. The new value is 2,300.
Reversing the order is the most common mistake in this whole process, because the formula looks symmetric and is not. The same pair of numbers, 4,000 and 5,000, gives a 25 percent increase going forward and a 20 percent decrease going the other way. Those are two different claims about two different stories, and only one of them is true about your data.
2. Subtract the original value from the new value
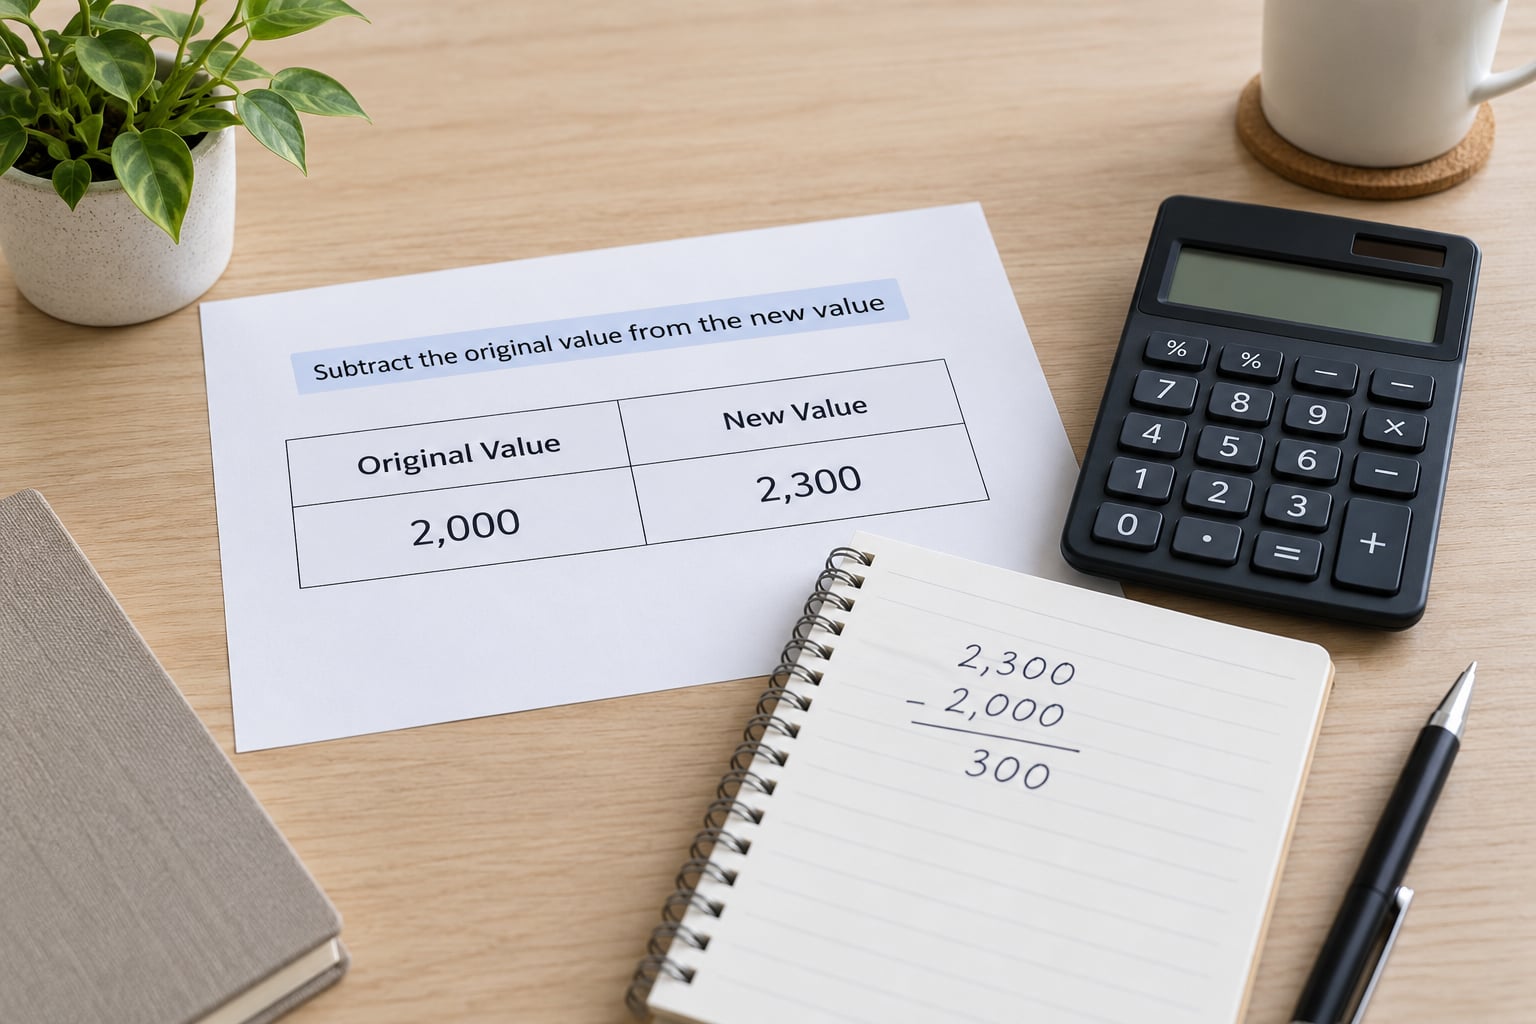
Subtract in a fixed direction: new minus original. For the newsletter example, 2,300 minus 2,000 equals 300.
That 300 is the numerator, and it is also just a raw count. On its own it tells a reader nothing useful, because 300 more subscribers sounds large to a small publication and trivial to a large one. Dividing by the baseline is what turns the raw count into a comparable statement.
Why divide by the original value rather than the new one? Because the baseline defines the scale you are measuring against. The 300 is being measured against the 2,000 it started from, so 2,000 is the denominator. Dividing by 2,300 would express the same 300 against a number that did not exist at the start of the period, which is not a measure of change at all.
3. Divide the difference by the original value
Divide the difference by the original value: 300 divided by 2,000 equals 0.15.
That 0.15 is a decimal ratio, not 15 percent. It is the easiest place to stop early and then report a nonsense number, because a spreadsheet cell formatted as a general number will happily display 0.15 while the story calls it a percentage.
A useful mental check: for a change that is less than half the original value, the ratio here will be a decimal below 0.5. If you ever see a ratio above 1 for what someone described as a modest move, keep going and check the subtraction.
4. Multiply by 100 and add the percent sign
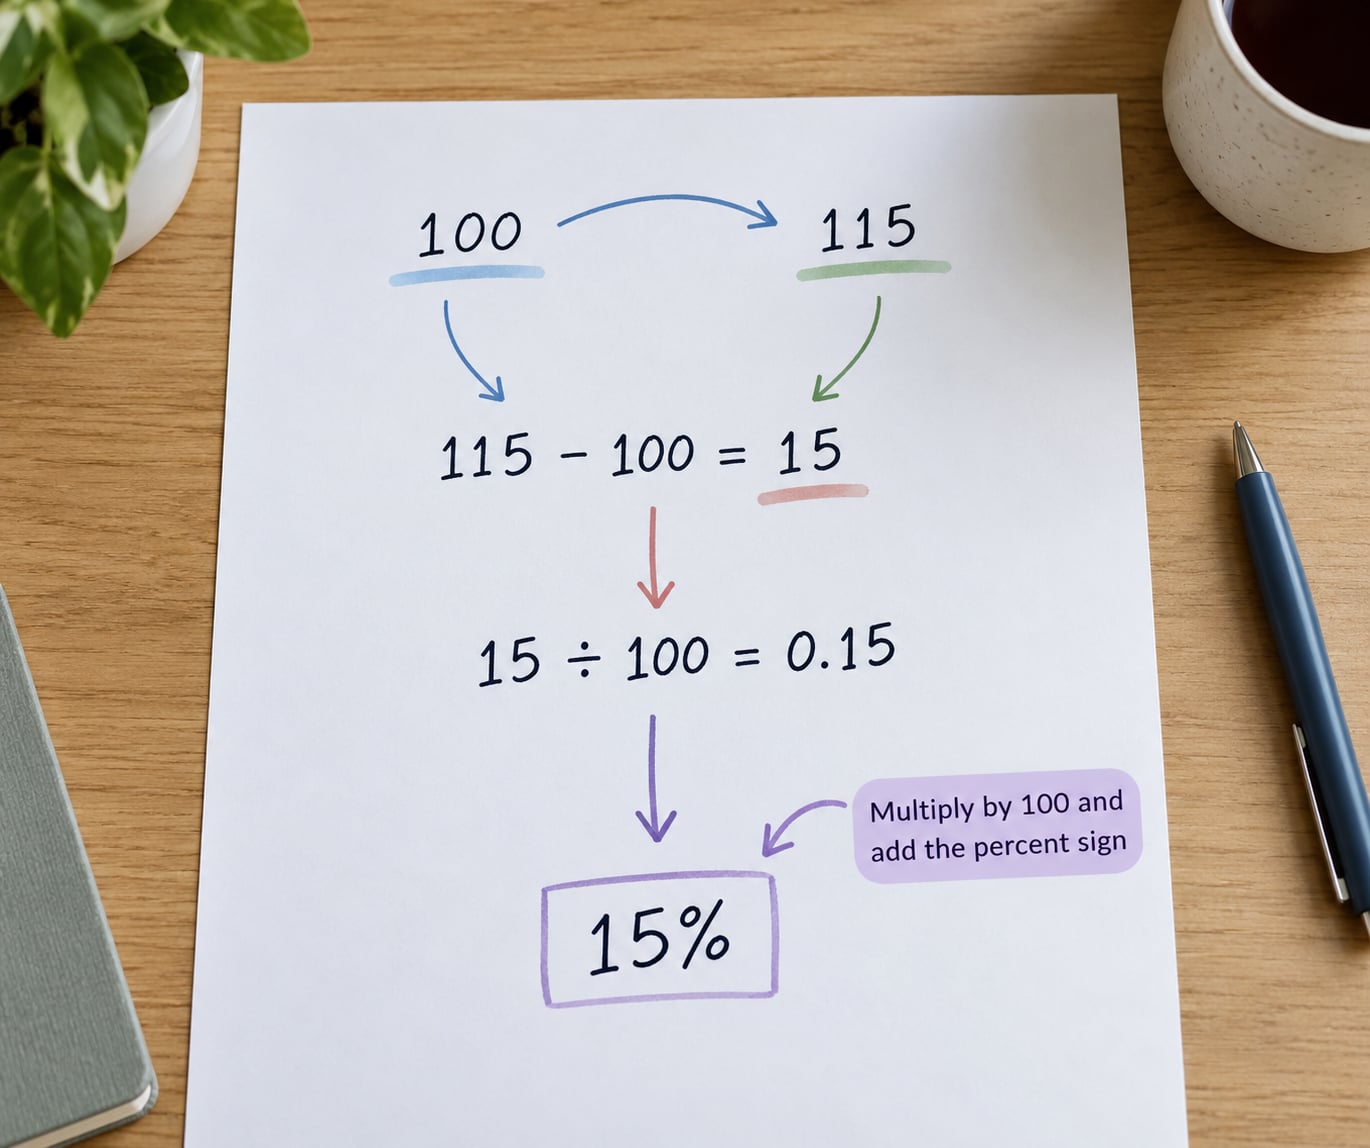
Multiply the ratio by 100: 0.15 times 100 equals 15. The change from 2,000 to 2,300 is a 15 percent increase.
This is the point where you need to calculate percent change correctly for the last time, because everything after this is interpretation. The sign tells the story. Positive means the new value is above the baseline, negative means below, and a result of exactly zero means nothing moved.
Here is the full sequence in one line, for the newsletter example:
((2,300 – 2,000) / 2,000) x 100 = 15 percent increase
Now run a decrease. Subscribers fall from 2,300 to 2,000: ((2,000 – 2,300) / 2,300) x 100 = -13.04 percent. Note the denominator moved. It is 2,300, because that is where this comparison started. A 15 percent increase followed by a 13 percent decrease does not return you to the starting point, and that asymmetry is not a rounding artifact.
5. Check the result and report it clearly
Before the number goes anywhere near a headline, run three checks.
- Divide the change by the baseline and ask whether it looks plausible. A jump from 2,000 to 3,000 is 50 percent. A jump from 2,000 to 2,300 is 15 percent. If your result feels too small, the difference may have been divided by the new value.
- Check the sign against the plain-language direction. If the new value is lower, the result must be negative. Reading -13 percent as “up 13 percent” is a copy error that survives to publication more often than you would expect.
- Reverse the order and see whether the story changes. If 4,000 to 5,000 gives 25 percent and 5,000 to 4,000 gives -20 percent, your numbers are consistent. If they come out the same magnitude, you divided by the midpoint rather than the baseline.
In a spreadsheet, the formula in its usual form is =(B2-A2)/A2, with A2 holding the original value and B2 the new one. =(B2/A2)-1 does the same job. Format the result cell as a percentage rather than typing a times 100 into the formula, because multiplying by 100 inside a cell that is already percentage-formatted is the single most common source of numbers that are 100 times too large. On Windows the shortcut is Ctrl+Shift+%; the ribbon button works everywhere. If the baseline cell is empty or zero you will get a #DIV/0! error, which is the spreadsheet telling you exactly what the math is telling you.
For reporting, the phrasing carries as much weight as the number. Write “rose 15 percent from 2,000 to 2,300”, and put the period in the text: “from 2,000 subscribers at the end of March to 2,300 at the end of June”. A chart label reading “+15%” is fine as long as the axis says what the values are.
One more check applies when you did not do the arithmetic yourself, which is most of the time when you are reading a headline rather than writing one. Take the stated percentage and work backwards: if a metric fell 20 percent, the original value must be five times the new value, so a headline claiming a 20 percent drop from 40 stores to 20 stores does not survive contact with the formula. Reconstruct the baseline from the current value by dividing by 1 plus the decimal rate, then look for the real-world number it implies. That exercise catches the two most common published errors, a reversed pair of values and a percentage-point change written as a relative one.
The reverse calculation is useful well beyond fact-checking. If a price fell 15 percent to reach 88, the original price was 88 divided by 0.85, which is 103.53. Markups, discounts and annual projections all work this way, and rounding the recovered baseline to a tidy number is where reverse percent change goes wrong.
Common Mistakes
Dividing by the new value. This gives a smaller, wrong answer every time: 300 divided by 2,300 is 13 percent, not 15. The denominator is the value at the start of the comparison.
Confusing percent change with percent share. Percent change answers “how much did this move”. Percent share answers “what slice of the total is this”. If a metric rose from 4 percent to 5 percent of total traffic, that is a rise of 1 percentage point and a rise of 25 percent relative change, and the two are not interchangeable in a sentence.
Treating a negative result as an increase. A minus sign is a direction, not an error. If the formula returns a negative and the plain reading of the data is a rise, something in the setup is reversed.
Using the wrong baseline. Comparing this quarter to the quarter before last quarter is a valid calculation and probably a misleading one. Pick the period that matches the claim you intend to make, and name it.
Rounding too early. Carry one extra decimal through the division and round only the final answer. Rounding the ratio 0.15 to 0.2 and reporting 20 percent is the kind of error that only shows up when a reader does the arithmetic themselves.
Averaging percentages across several periods. Changes compound, so the average of the individual percentages is not the total change. A metric moving 10 percent, then 9.1 percent, then 9.1 percent ends up about 30 percent higher, and the arithmetic average of those three numbers understates it. For a total across periods, multiply the growth factors, or use the compound annual growth rate formula for annualized comparisons.
Frequently Asked Questions
How do I calculate percent change in a spreadsheet?
Put the original value in cell A2 and the new value in cell B2, then enter =(B2-A2)/A2 in the next cell and format it as a percentage. =(B2/A2)-1 gives the same result. Fill the formula down the column to cover a whole series. Do not multiply by 100 inside the formula if the cell is already percentage-formatted, and expect #DIV/0! when the baseline cell is blank or zero.
What is the formula for calculating a percentage decrease?
Percentage decrease uses the same formula as percentage increase: ((New Value – Original Value) / Original Value) x 100. A fall from 2,300 to 2,000 gives ((2,000 – 2,300) / 2,300) x 100 = -13.04 percent. Many style guides report the size of a decrease as a positive number and let the word carries do the work, so -13.04 percent and a 13.04 percent decrease are the same finding.
Should I divide by the original value or the new value?
Divide by the original value, always. The baseline is the reference the change is measured against, so it belongs in the denominator. Dividing by the new value gives a smaller number that does not describe the change: 300 divided by 2,300 reads as 13 percent when the true change from 2,000 to 2,300 is 15 percent. The exception is percent difference, a symmetric measure used for comparing two independent values where neither is the baseline.
How do I calculate percent change across multiple periods?
Do not average the individual percentage changes, because changes compound. For a total over several periods, divide the final value by the starting value and subtract 1. For an annualized rate over n periods, use the compound annual growth rate formula: (final / initial) raised to the power of 1 divided by n, minus 1. Over three years, a metric rising from 100 to 133.1 has a compound annual growth rate of 10 percent, not the 11 percent an arithmetic average suggests.
What is the difference between percent change and percentage points?
Percent change is a relative movement measured against the original value. Percentage points are the arithmetic gap between two rates or shares. A rate moving from 2 percent to 4 percent rose 2 percentage points, and that is the correct phrasing, because the relative percent change would be 100 percent and would sound like the share doubled when it did not. Newsrooms and analysts get this wrong often enough that readers notice.
How should journalists round percent change results?
Carry full precision through the division and round only the final figure, usually to one decimal place for changes above 10 percent and to whole numbers for smaller ones. Report changes under about 1 percent as decimals, since rounding them to zero hides a real movement. Always name the baseline period in the same sentence as the percentage, so a reader knows what the comparison is against.
Conclusion
Percent change is ((new value – original value) / original value) x 100, with the original value in the denominator and the sign telling you the direction. Start by writing down both values and labeling which one came first.
Four checks catch most of the remaining errors: the order of the values, the choice of baseline, the phrasing of the result, and the temptation to average percentages across periods when changes actually compound. Get those right and the number is usually right. Skip one and the story is wrong in a way that reads perfectly.