
FBI crime data measures reported crime, not all crime. Every figure in the Uniform Crime Reporting program sits several filters downstream of an actual offense, and the filters shift from year to year. Learning how to use FBI crime data without misleading readers means naming those filters out loud, matching every claim to what the dataset actually counts, and telling readers what the data cannot answer.
It takes about fifteen minutes of disciplined work per story, once you know the pipeline. The rest of this guide is that pipeline, the traps in it, and a checklist you can run before filing.
What You Need
Six things. None of them are exotic, and all of them change what you can safely claim.
- The FBI Crime Data Explorer. This is the public portal where the raw agency submissions live. Know the difference between its data sets before you click anything: Offenses Known, Arrest data, Supplemental Homicide Reports, Law Enforcement Officer Killed or Assaulted, hate crime data, and property stolen tables answer different questions.
- The specific years and geographic level. National, state, county, and agency views are separate products. So are the annual cycles: calendar year, fiscal year, and the Crime in the Nation near-real-time view all cut the same data differently.
- The FBI methodology and definitions. Offenses Known, the hierarchy rule, unfounded crime, index crimes, and how a Group A offense differs from a Group B offense. Definitions are where most misreporting starts.
- A spreadsheet and a population source. Census Bureau estimates for the denominator, or the FBI’s own population coverage figures. Raw counts without a population are not a rate.
- The release date and revision history of the file you pulled. Save the download, the date, and the table name in your notes the moment you export it.
- A written plan for limitations. Decide the caveats before you write the lede, so you cannot bury them under a headline that already overclaims.
How to Use FBI Crime Data Without Misleading Readers
The core workflow is a three-stage filter: verify the source, normalize the numbers, then frame the finding. Skip any stage and your story inherits an error you cannot see from the finished page. Knowing how to use FBI crime data without misleading readers comes down to running all three stages in order, every time, even on a story you have already run once.
Choose the right FBI dataset and time period
Pick the dataset that matches the verb in your sentence. Offenses Known counts what law enforcement learned about. Arrest data counts arrests, which is not the same as offending. Clearances by Arrest counts cases cleared, and a case can be cleared by arrest of a different person than the one suspected.
Confirm the years before you compute anything. When the FBI moved most agencies to the National Incident-Based Reporting System, participation and coverage collapsed for several cycles, so a chart that treats the whole series as continuous is drawing a line through a gap.
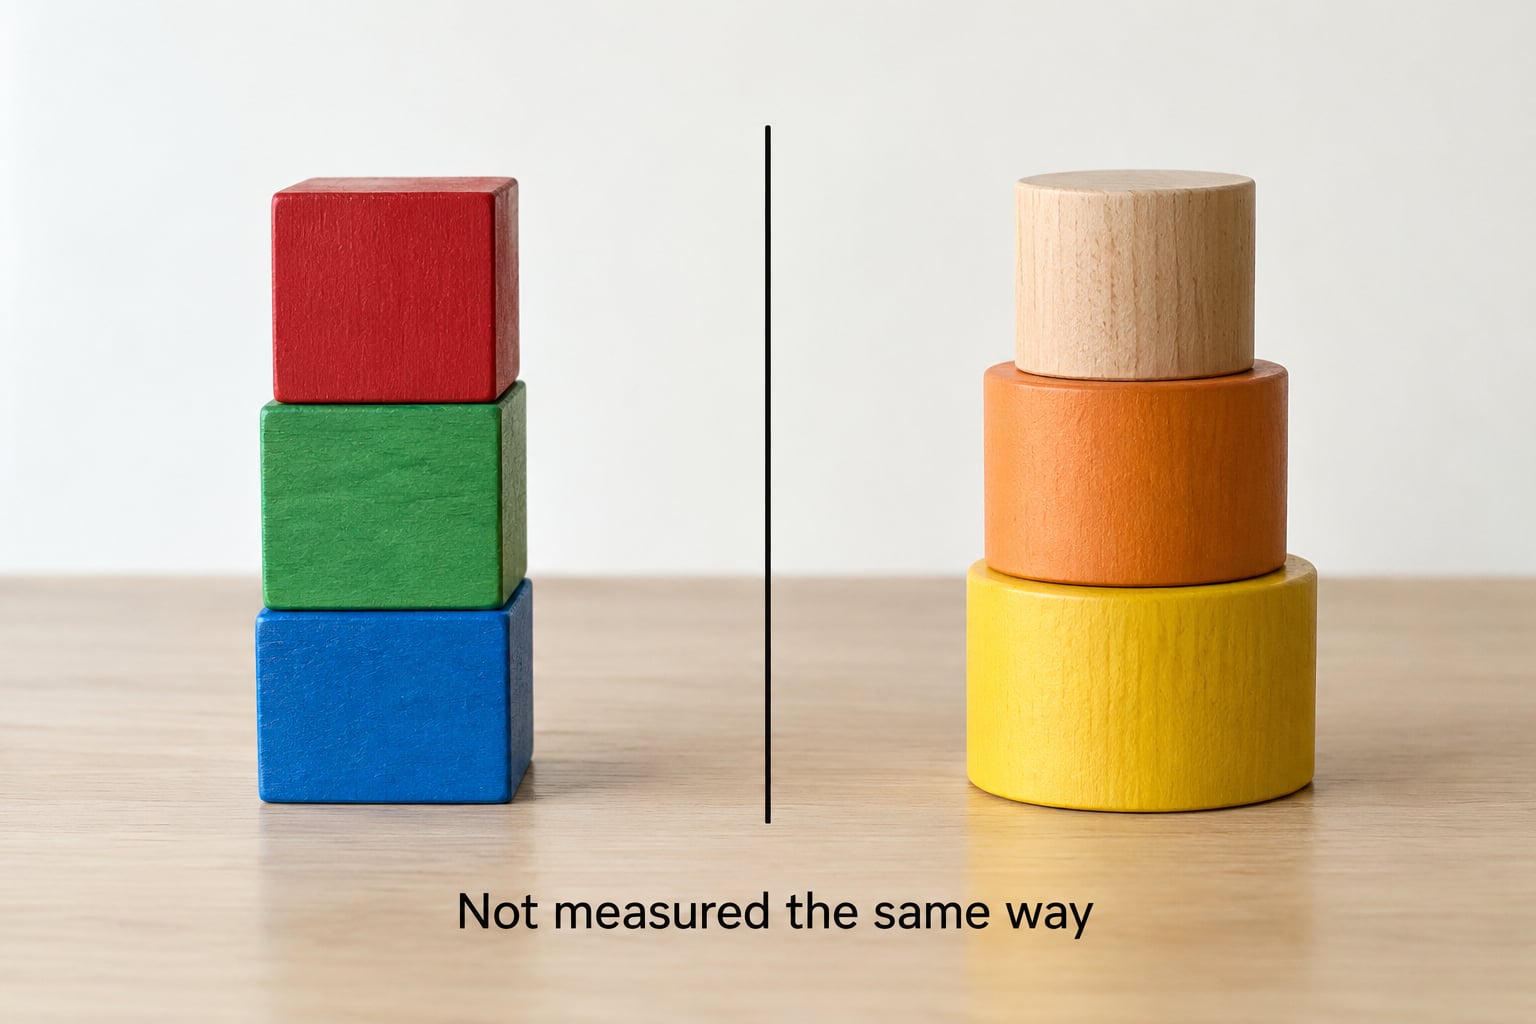
Never splice incompatible series into one trend line. If you must bridge SRS years and NIBRS years, mark the transition on the chart itself and say in the text that the two halves are not measured the same way.
Check definitions, coverage and methodology
Two datasets can carry the same label and count different things. The hierarchy rule is the clearest example: only the most serious offense in a single incident gets counted, so a robbery that includes an aggravated assault and a weapon may appear in the table once, as robbery.
Coverage is the second check. Agencies report voluntarily, and some submit late, submit only part of the year, or stop mid-series. The FBI publishes population coverage so readers can see what share of the country a national figure rests on. If the jurisdictions missing from your comparison are the large ones, say so rather than implying a national result.
Third, check for imputed data. When an agency does not report, the FBI can estimate. Estimated values carry uncertainty that actual submissions do not, and a number that mixes the two should not be charted as though both were observed.
Finally, pin down the geography. City limits, county lines and metropolitan statistical areas are different shapes, and comparing a city against a surrounding suburb produces a rate difference that says more about boundaries than about crime.
Calculate changes and rates responsibly
Three calculations do most of the work in crime stories, and each has a failure mode.
Absolute change. Subtract the earlier count from the later one. Simple, and it tells readers how many incidents changed. It also rewards big populations for small percentages and punishes small ones for the same movement in real terms.
Percentage change. (New minus old) divided by old, times 100. The trap is the denominator. A town that moves from two burglaries to four has a 100 percent increase and one additional burglary. If the base is under about 20 incidents, publish the raw count beside the percentage or drop the percentage.
Rate. Count divided by population, times 100,000 for the standard violent and property crime rates. Use the matching year’s Census estimate. Mixing a three-year numerator with a single-year population produces a rate that looks precise and isn’t.
Two habits cut a lot of trouble. Use a multi-year average for volatile categories such as homicide, because single years swing on small numbers. And check whether the change you found is larger than the noise: when a series bounces back toward its long-run level the following year, the honest headline is “unchanged,” not “spike.”
Write the headline, chart and methodology note
Write the sentence you can defend, then make the headline shorter than that sentence rather than stronger. If your analysis supports “reported violent crime in the county rose modestly last year,” the headline is not “Violent crime surges.”
Label charts honestly. Say whether an axis shows reports or offenses, whether a figure is an estimate, and note any break in the series. Readers should be able to tell from the chart alone what kind of number they are looking at.
Include a methodology note that names the data set, the exact table or download, the years, the population source, and the FBI release date you used. Add one sentence on reporting to police: FBI figures put the share of violent crime reported at roughly half, and property crime lower still. Readers who know that will read your number correctly on the first try.
When you have a comparison table, keep the caveat on the page, not in a footnote. A note nobody scrolls to has not been made.
Common Mistakes
Eight errors account for most of the misleading crime reporting I have seen. Each one has a straightforward fix.
- Treating reports as unique crimes. One victim, one assault, one arrest record. A person victimized twice can generate two offenses, so language like “victims” attached to a reported-offense count is wrong. Say “reported offenses” and describe what the unit is.
- Implying national completeness. National estimates rest on participating agencies, and coverage varies by year and by place. State the population coverage in the story, not just in a footnote.
- Comparing incompatible years. SRS and NIBRS count differently, and the transition years are thin. Break the series, mark it, and refuse to draw a continuous line through it.
- Confusing correlation with causation. A crime trend and a policy change moving together is a coincidence in timing. Say what the data shows, then attribute any causal claim to someone who can support it.
- Presenting estimates as exact counts. A national figure with an imputation is not a census of incidents. Round it, label it as an estimate, and resist converting it into a body count in the lede.
- Ranking raw counts across cities. Larger cities generate more incidents because they have more people. Use per-capita rates, state the population vintage, and be careful that city boundaries are not doing the work of the comparison.
- Letting a one-year move set the frame. Single-year changes in small categories are noise. Lead with the multi-year line so readers see the baseline before the headline number.
- Reading arrest data as guilt. Arrest data measures police activity. Most people arrested are not convicted, and arrest patterns reflect enforcement as much as offending. Use arrest data to describe enforcement, not to describe criminals.
One more deserves its own note. If the honest reading of the data is that it cannot answer the question, publish that. A story that explains why the coverage gaps prevent a conclusion is more useful than a confident number built on a series that breaks halfway through.
Frequently Asked Questions
How can crime statistics be misleading?
Crime statistics describe reported crime, so they reflect what victims tell police, what officers record, and what agencies submit. Underreporting, unfounded clearances, the hierarchy rule counting one offense per incident, changing agency participation and imputed estimates all shift the number away from what happened. Add population and boundary effects and a precise-looking figure can support the opposite of the truth.
Why can uniform crime reports be misleading?
The Uniform Crime Reporting program depends on voluntary agency participation, so national figures cover only part of the country and the share changes year to year. The hierarchy rule counts only the most serious offense in an incident, and monthly agency returns can include negative counts when crimes are ruled unfounded. Year-over-year comparisons also break when agencies switch between the Summary Reporting System and NIBRS.
Who reports crime data to the UCR?
Individual U.S. law enforcement agencies report to the program. A records management system generates the monthly return, the agency sends it to its state UCR program, and that state program forwards the data to the FBI. The FBI edits, audits and combines submissions into the national tables published in the Crime Data Explorer. No agency is compelled to submit.
Which crime report is compiled annually by the FBI?
The FBI compiles the annual Uniform Crime Reports publication, drawn from state UCR programs and covering offenses known to law enforcement, arrests and clearances, and law enforcement officers killed or assaulted. Since 2021 the National Incident-Based Reporting System has replaced the old summary tables for most agencies, so the contents and coverage of the annual release differ from earlier editions.
How is NIBRS better than UCR?
NIBRS records each offense in an incident rather than only the most serious one, and it captures victim, offender and relationship detail, Group A and Group B offenses, and location data. That granularity supports victimization and clearance analysis the summary tables could not support. The tradeoff is narrower coverage and harder year-over-year comparison, since fewer agencies report incident-level detail.
How do you cite FBI crime data in a story?
Name the data set and the exact table or download, the years covered, the geographic level, the population source used for any rate, and the FBI release date. Say whether figures are reported or estimated and state the population coverage. Save the file and your calculation sheet alongside the draft so the numbers can be reproduced later.
Conclusion
Start with the sentence your data can actually support, and treat every number as reported rather than real. Download the file, save it with the date, then check the definitions, the coverage and the boundaries before you compute a single percentage.
Most misleading crime stories come from doing the arithmetic correctly on the wrong unit. The habit that fixes it is unglamorous: name the unit before you name the trend. Run the eight mistakes list against your draft before filing, and publish the limits alongside the finding rather than after it.