To clean messy data in Excel, you work on a copy, fix one problem class at a time, and record every change you make. Dirty data is anything with errors, duplicates, gaps or inconsistent formatting that makes a number unreliable, and a spreadsheet that arrived from a records request, an open data portal or a PDF conversion is almost always full of it. Get that wrong and the chart is wrong, and the correction lands after publication.
This guide is the workflow I hand reporters who are about to chart a spreadsheet for the first time. It is Excel only, no coding, and every step has a check you can see on screen. Budget an hour for a typical records file, more if the source is a PDF conversion.
Short version of the method: preserve the original, profile the sheet, standardise types and text, remove real duplicates, mark the gaps, reconcile names, then save a documented clean copy. Skip ahead to the step-by-step section if you already know the shape of the problem.
Table of Contents
- What You Need
- Step-by-Step
- Common Mistakes
- Frequently Asked Questions
- What is the fastest way to clean messy data in Excel?
- Should I remove duplicate rows automatically in Excel?
- How do I handle blank cells versus zero values in a newsroom spreadsheet?
- Can Power Query clean messy data in Excel for reporters?
- How do I standardize inconsistent dates and location names?
- How can I document Excel cleaning steps so another reporter can reproduce them?
- Conclusion
What You Need
You need Excel for Microsoft 365 on a desktop, or Excel 2021 or later. The desktop ribbon has Text to Columns, Power Query and Remove Duplicates with the options used here; Excel for the web is missing several of them and behaves differently when you paste values.
You also need the untouched source file, kept separately. Never clean the file that came out of the records office, and never clean the only copy.
Third, use a practice file while you learn. Public spending registers, council expenditure exports and stop and search data are good because they arrive with real inconsistencies, but the errors vary. If you want a controlled set, build a small sheet with the problems in the table below deliberately planted in it.
| What the source does to you | What Excel shows |
|---|---|
| Ages entered as a range | 10-17 read as a date in October 2017 |
| Company numbers exported as numbers | Leading zeros gone, 004512 becomes 4512 |
| Text pasted from a web page | Nonbreaking spaces and stray line breaks |
| Agency names written five ways | Five rows in a pivot table where there should be one |
| Amounts with mixed separators | 1,234.56 and 1.234,56 in the same column |
| Blank means nothing recorded | Excel counts it as a real zero |
Two free companions are worth installing later, not now: OpenRefine for clustering thousands of near-identical name variants, and a PDF table extractor such as Tabula when the records office sent a scan instead of a spreadsheet. Excel is the right tool for a few hundred rows. It is the wrong tool for a few hundred thousand, or for a monthly refresh of the same file, which is where Power Query takes over in step six.
Step-by-Step
How to Clean Messy Data in Excel for Reporters
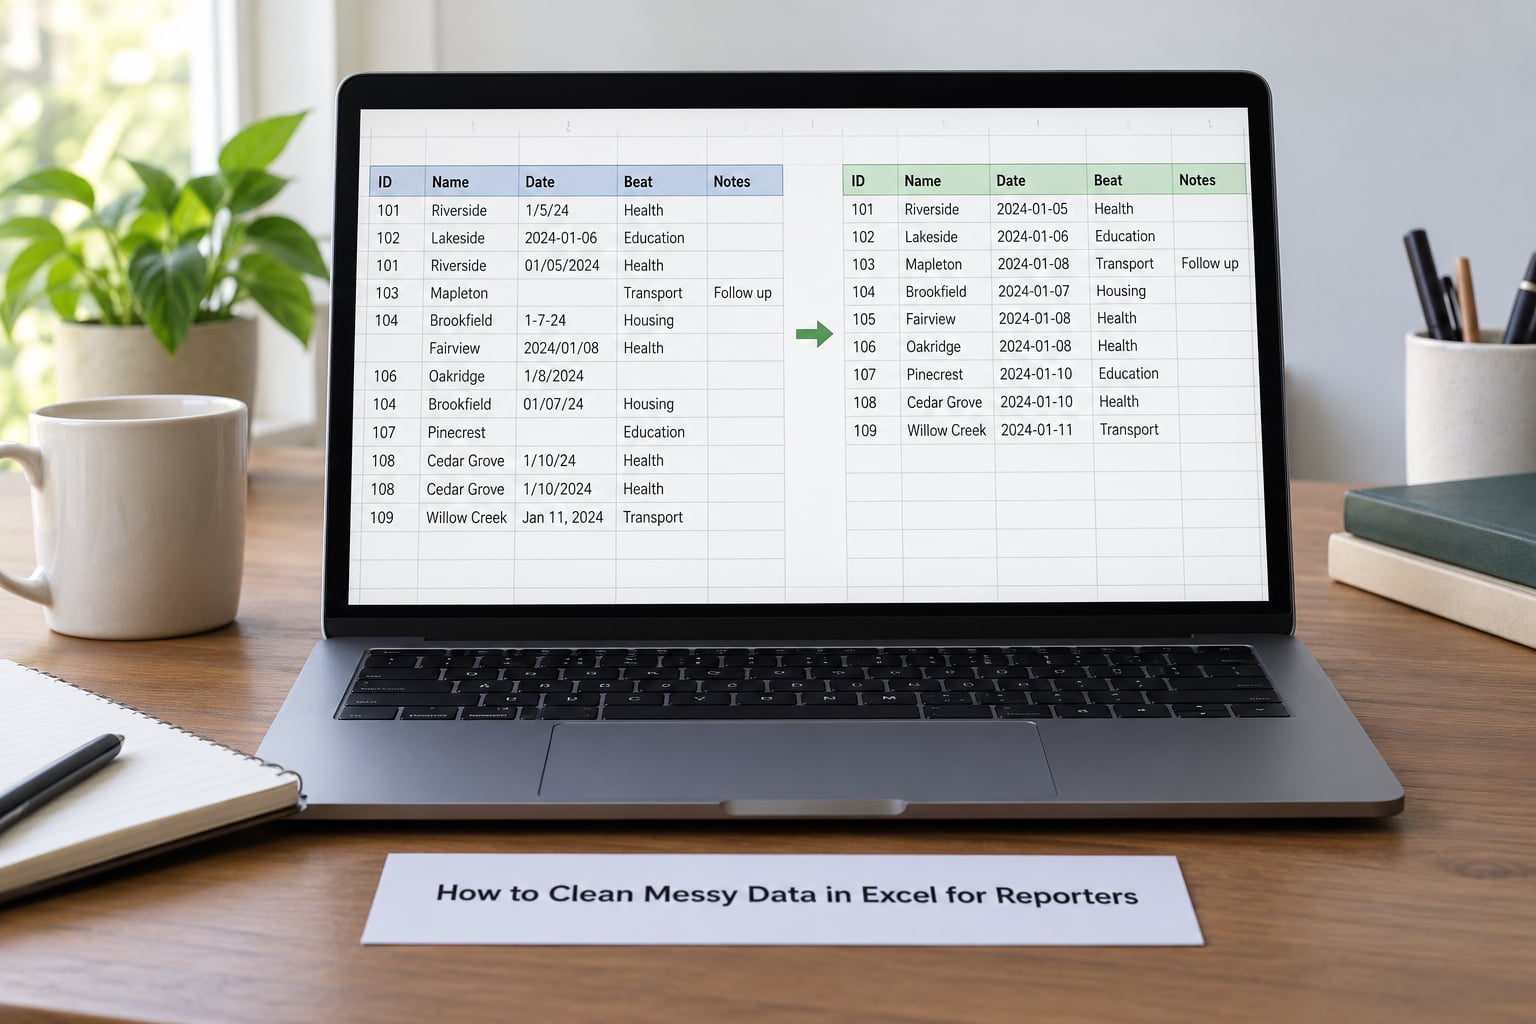
Start by duplicating the file. Save As, then name the copy with a date and the word clean, so the original sits untouched in the folder with the FOI paperwork. Right click the sheet tab, choose Move or Copy, tick Create a copy, and give it a working name.
Then look at the structure before you touch a single value. Press Ctrl+Home. Is row 1 a title banner with the real headers in row 3? Are there merged cells across the top? Any frozen panes that hide columns? Delete those banner rows and unmerge everything: select the sheet, Home, Merge and Center, then Unmerge Cells. A banner row above your headers is the single most common reason a filter grabs the wrong range.
Now strip the empty rows and columns. Select all, then Data, Filter, clear any filter still applied, and switch AutoFilter off so blank rows are visible. Select them, right click, Delete. Do the same for columns that hold nothing but formatting.
Check: click any cell and look at the Name Box. It should read something like A1, and every column should have one header in row 1 with values directly beneath it. Press Ctrl+End to jump to the last used cell; if that is row 4,000 and column AZ, but your data only occupies 40 columns, you have a stray range to remove.
Finally, turn the range into a real table. Click inside it, then Insert, Table, then Table. Formulas fill down automatically, new rows inherit validation and formatting, and the whole thing survives a monthly paste.
Standardize Dates, Numbers and Text
Dates arrive in every format the exporting software felt like. Select the date column, then Data, Text to Columns, choose Delimited, click Next, and set the column data format to Date with a format you recognise, such as DD/MM/YYYY. That is a conversion, not a cosmetic change: the cells switch from text to real dates and can now be sorted and filtered by month.
The Text to Columns wizard is also the fix for the 10-17 trap. An age range typed as 10-17 is not a date, it is a range, so convert it to text first with Format Cells, Text, then split it into two columns with the delimiter set to a hyphen.
Numbers stored as text are the other trap. They sort alphabetically, so 9 outranks 100. Select the column, click the warning triangle Excel shows and choose Convert to Number. If there is no triangle, the values contain a stray character; apply VALUE from a helper column to see the error, then clear it.
Leading zeros on company and charity numbers cannot be recovered once they are gone, so re-import those columns as text before touching the file, and go back to the source if the zeros are already missing.
Text needs three passes. First =TRIM(CLEAN(A2)) removes spaces at the edges and nonprinting characters. Second, =SUBSTITUTE(A2,CHAR(160)," ") kills the nonbreaking space that web copy and PDFs bring with them, and it is the usual reason a lookup against a clean list returns #N/A. Third, =PROPER(A2) or =LOWER(A2) normalises capitalisation, which is what makes a pivot table group rows correctly.
Check: add =ISNUMBER(A2) and =ISTEXT(A2) in a scratch column and scan for FALSE where you expected TRUE. Then convert your helper column to values: select it, Ctrl+C, then Home, Paste, Paste Values.
Find and Remove Duplicate Records
Count before you delete. In an empty cell, =COUNTA(A:A)-SUMPRODUCT(1/COUNTIF(A:A,A:A)) gives the number of duplicate values in a key column. Subtract it from the total row count and you know exactly what you are about to lose.
Now compare rather than trust. Add a helper column with =COUNTIFS(A:A,A2,B:B,B2) over your identifier columns. Anything returning 1 is unique, anything above 1 is a candidate. Filter to those rows and read them. Two people named the same on the same date in the same ward may be two stops, not one.
When a row really is repeated, select the data range, go to Data, Remove Duplicates, and choose only the columns that make a record unique. Tick the header row. Excel tells you how many rows it removed; write that number down, along with the row numbers, for your method note.
Check: re-run the row count. It should be the original minus the number you wrote down, no other change.
Handle Missing Values Without Inventing Data
A blank cell is not a zero. In a spending file, a blank amount means the value was not recorded, and turning it into 0 tells readers a payment of nothing happened when in truth nobody knows. Replace placeholders such as n/a, N/A, -, unknown and TBC with one consistent token, usually blank plus a note, or the word unknown.
Where a figure is missing but an average would be misleading, leave it out and state that in the story. Never interpolate a number that gets printed, never carry a value forward from the previous row unless the source document says it continues, and never infer a location from the postcode prefix without checking it.
Isolating the gaps is a one-liner. Add =COUNTBLANK(A2:A1000) for a total, then =COUNTIFS(A2:A1000,"",B2:B1000,"") to find blanks in a specific field. Conditional formatting makes them visible: Home, Conditional Formatting, Highlight Cells Rules, Blanks, with a light red fill.
Check: every missing value you leave in place is one you can point to in your notes.
Validate Names, Locations and Categories
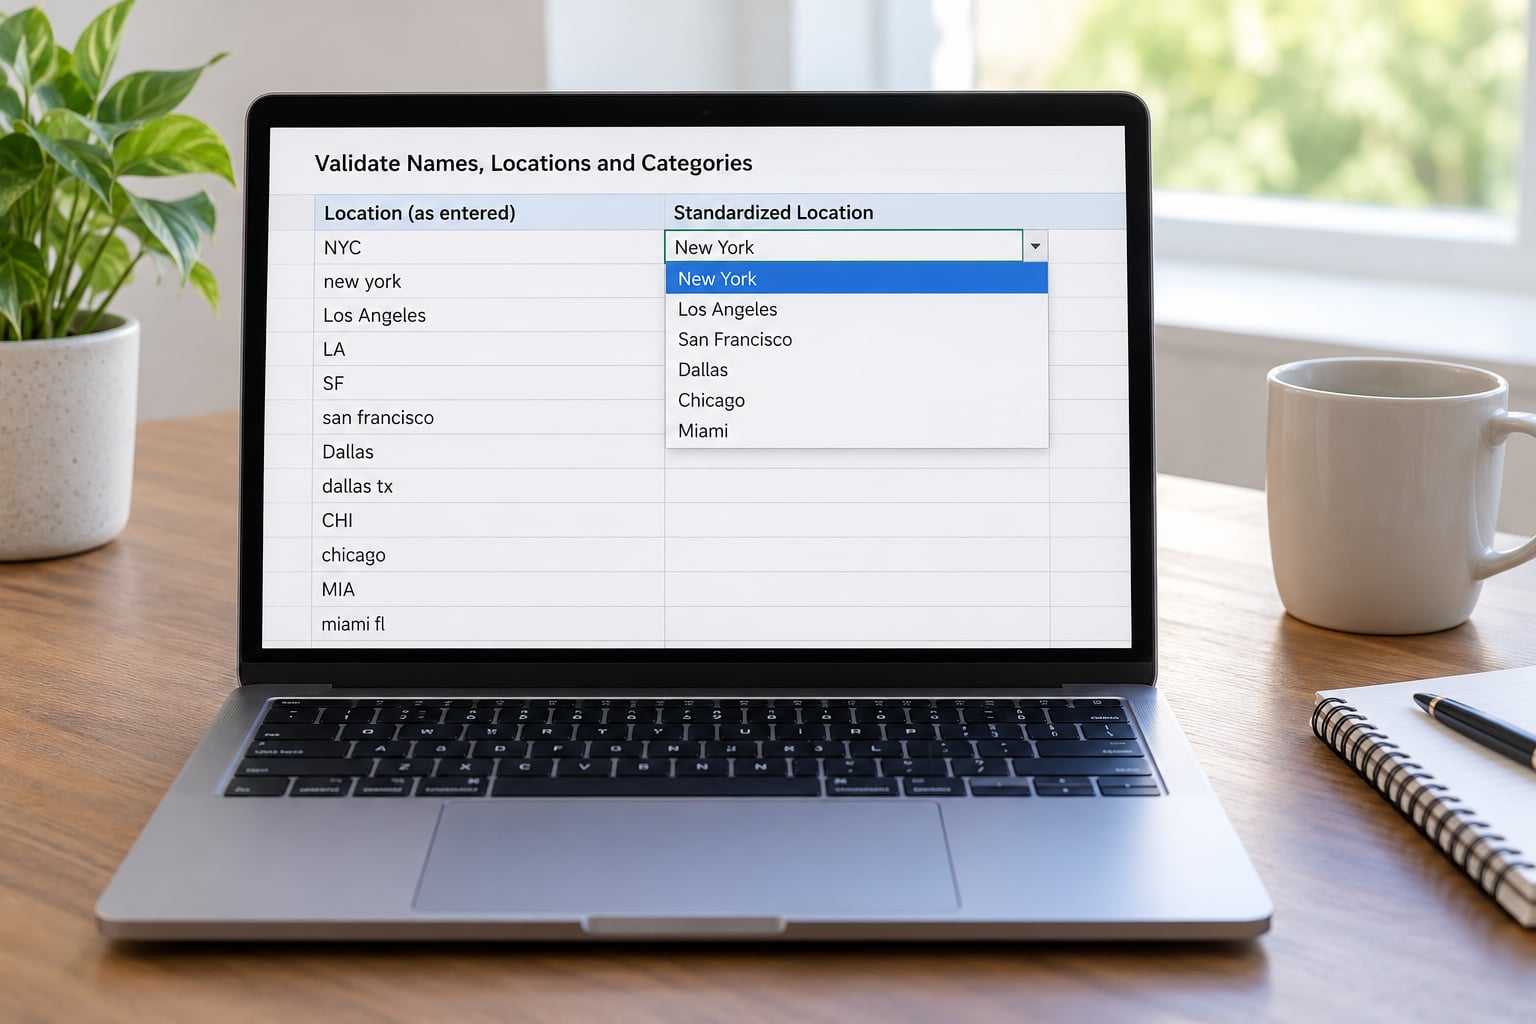
Inconsistent names are what splits a pivot table into five rows where there should be one. Build the correct list once on a separate sheet, sort it, and match the messy column against it. =XLOOKUP(TRIM(A2),Lists!$A:$A,Lists!$B:$B,"review") does the work; on older Excel use VLOOKUP with the match mode set to exact.
Go through the results and fix the source list, not the formulas, once you are satisfied the mapping is right. Then select the cleaned column, go to Data, Data Validation, Allow: List, and point it at your reference list. Anyone adding a new row later gets a dropdown instead of free typing, which is how the mess stops coming back.
When you have thousands of variants rather than dozens, stop using Excel for this part. OpenRefine’s cluster and edit groups similar strings by a fingerprint and lets you merge a whole cluster with one click, then exports back to the sheet. The forum consensus among people who do this daily is the same: Excel is fine until the last 10 percent of entity variants, and that last 10 percent is where Excel based approaches stall.
Check: build a pivot table of the category column. Every row should be a real category you would be willing to print.
Create a Reproducible Clean Dataset
Save the result as a new file, not as the working copy, named with the date, the source and the word clean. Someone else has to be able to pick it up in six months and follow your work.
Three things make that possible. First, paste everything as values so no formula depends on a helper column you are about to delete. Second, keep a data dictionary in a second sheet: field name, what it means, the units, the source and the date received. Third, write a method note, even a short one, listing each transformation, the formula used, the rows removed and every judgement call you made.
Then export in a stable format. CSV with UTF-8 encoding keeps accents intact for newsroom tools and chart services, which matters when a place name like Málaga comes back mangled. Save the cleaned workbook alongside the CSV so the dictionary travels with it.
If the same file arrives every month, stop doing this by hand. Data, Get and Transform Data, then From File, loads the sheet into Power Query. Each step you apply is recorded in the query editor and re-applies to the next file automatically, so the cleanup becomes a repeatable refresh instead of an afternoon of repetition.
Check: open the exported file on a second machine or in a browser based tool. If the accents, dates and numbers survive, it is portable.
Errors That Ruin a Dataset
Sorting before inspecting reorders rows and can break formulas that reference neighbours. Sort a copy if you must, and always sort a full data range, not a single column, or the rows desynchronise and every record becomes a lie.
Overusing Find and Replace is the fastest way to alter data you did not mean to touch. Replacing a-t with at hits place names, first names and URLs. Use a helper column and a formula you can see and undo, and keep Find and Replace for whole-column terms you have verified.
Converting a whole column to dates when some values are not dates turns those cells into #VALUE! errors that then spread through downstream calculations. Test a representative sample first, and look at how many cells Excel reports as converted.
Pasting formatting from a source file brings column widths, colours and merged cells with it. Paste Special, Values, and skip the formatting entirely.
Quick Quality-Control Checklist
Before the file goes anywhere near a chart, run this list. Row count matches the source minus the documented duplicates. Every record has an identifier, or you know why it does not. The date range starts and ends where the source says it should, with no 1900 or 2100 outliers. The amount column is numeric end to end, with no green triangles left. The category column produces categories a reader would recognise.
Then take five random rows and trace them back to the original document by hand. If any of the five does not survive the trip, the cleaning is not finished. Finally, check every figure you intend to publish against the source once more before it goes to an editor.
Common Mistakes
Cleaning the only copy of the file. This is the mistake with the worst consequences, because the audit trail back to the agency disappears. Keep the raw export in a folder that is never edited, with the request reference in the filename.
Treating blanks as zero. This quietly changes totals, averages and percentages, and it is invisible in the finished graphic. Mark them unknown and report the gap instead.
Deleting valid duplicates because the rows look identical. Two stops on one street in one hour, or two invoices from the same supplier, can be genuinely separate events. Check the fields that distinguish them before you remove anything, and log what you remove.
Cleaning columns the story never uses. A records file with 40 columns does not need 40 clean columns. Work out which fields your story requires, clean those properly, and leave the rest. Scope is the difference between a two-hour cleanup and a two-day one.
Cleaning someone else’s data without a note. People debate this in r/dataanalysiscareers, and the recurring view is worth following: cleaning should preserve the original meaning, never invent values, and be documented. If the source organisation sent the file with errors, send the errors back and keep your corrections in a separate column, so nothing is silently overwritten.
Doing everything inside Excel. The same forum thread that recommends Power Query also carries the honest counterpoint: limit the transforming done inside the spreadsheet. Once you are rewriting half the columns by hand every month, you have outgrown a worksheet.
Frequently Asked Questions
What is the fastest way to clean messy data in Excel?
Work on a copy, then run the fixes in order: remove banner rows and empty columns, use Text to Columns to convert dates and numbers, apply TRIM and CLEAN plus SUBSTITUTE for nonbreaking spaces, and finish with Data, Remove Duplicates. For a file of a few hundred rows, that sequence takes under an hour and leaves a clean, documented sheet.
Should I remove duplicate rows automatically in Excel?
Not on the first pass. Count the duplicates first, then add a COUNTIFS helper column to separate exact repeats from records that merely look alike. Two stops at the same location in the same hour are two events. Read every candidate row against the source, remove only the true repeats, and record how many rows went and why.
How do I handle blank cells versus zero values in a newsroom spreadsheet?
Keep them distinct. A zero means a recorded measurement of nothing, a blank means nobody recorded it. Replacing blanks with zeros inflates counts and drags averages down without any visible warning. Standardise placeholders such as n/a or TBC into one token, leave the cell empty or mark it unknown, and state the gap in your published methodology.
Can Power Query clean messy data in Excel for reporters?
Yes, and it is the right upgrade for a file that arrives on a schedule. Data, Get and Transform Data, From File loads the sheet, and every trimming, splitting and type change you apply is recorded in the query editor and replayed on next month’s file. The trade-off is that a colleague who has never used Power Query cannot casually edit those steps.
How do I standardize inconsistent dates and location names?
For dates, select the column, run Data, Text to Columns, and set the column format to Date with one readable pattern such as DD/MM/YYYY. For names, build a correct reference list on a separate sheet and match with XLOOKUP or VLOOKUP, then attach a Data Validation dropdown to the column so new rows cannot reintroduce the variants.
How can I document Excel cleaning steps so another reporter can reproduce them?
Keep a method note beside the file listing each transformation, the formula used, the rows removed and every judgement call, plus a data dictionary sheet defining each field and its source. Finish by pasting formulas as values and exporting UTF-8 CSV. A desk editor should be able to follow the note and reach the same numbers without asking you anything.
Conclusion
Clean the data before you chart it, and do it in this order: preserve the original, fix the structure, fix the data types and text, remove real duplicates, mark the gaps, reconcile the names, then save a documented copy. Most of the work is deciding what the data actually says, and the formulas are just the tedious part.
Start with one thing this afternoon. Duplicate the file, remove the banner rows, and run ISNUMBER down the date column to see what you are really dealing with before you promise anyone a number.