
If you are searching how to document a data analysis for fact checking, the answer is short: you write down, before you publish, where every number came from and how it was produced — the source file and its URL, the snapshot date, every cleaning and filtering decision with before-and-after counts, the code or spreadsheet steps, the exclusions, and a line-by-line map from each figure in your draft to the output that supports it. A fact-checker can then re-derive your number rather than take it on trust. For a single story figure, that record takes 30 to 60 minutes if you write it as you go, and hours to reconstruct later.
The standard I work to is simple: if a fact-checker, an editor, or you in six months cannot follow the trail from the published sentence back to the raw row, the analysis is not documented. That is the whole game.
Working journalists on forums describe the gap clearly. Without a desk checklist, verification habits get written as loose notes — lines of data, lines of explanation, a few quotes — rather than a formal record anyone else can audit. Freelancers hit it harder, since there is no standards editor to ask. The fix is not a longer document. It is a fixed set of fields you fill in while the analysis runs.
What follows is the workflow I use, in the order I use it.
Table of Contents
- What You Need
- Step-by-Step
- Common Mistakes
- Frequently Asked Questions
- How detailed should fact-checking documentation be?
- Can I document an analysis in a spreadsheet instead of writing code?
- What should I do if a data source cannot be shared publicly?
- How do I show that a statistical result is reliable?
- Should fact-checkers publish the cleaned data as well as the raw data?
- Who should review a data analysis before publication?
- Conclusion
What You Need
Gather these before the first line of cleaning code, and the rest of the process is bookkeeping rather than archaeology.
- A claim sheet. The disputed statement, quoted exactly, plus your draft version of it as a testable question.
- A source inventory. Every file you plan to open, with the publisher, the landing URL, the licence, and whether it was fetched by hand, an API or a scrape.
- Version control or an equivalent. Git with the raw file committed once and never edited again, or, on a spreadsheet-only desk, a dated folder with a change log.
- A compute environment that can be described. Software and version numbers for anything that touches the data: your spreadsheet version, R or Python packages, the database engine.
- A codebook or data dictionary. Field names, units, and what a blank value means in each column you will use.
- A reviewer. Ideally a second person who did not build the analysis, booked at the same time you book the reporter.
Step-by-Step
Seven steps, each with a check you can fail. If any check fails, stop there rather than pushing the number forward.
Step 1: Define the Claim and the Verification Standard
Turn the statement into a specific, testable question and write down what evidence would confirm it and what would disprove it. “Crime is falling” is not testable; “reported violent crime per 100,000 residents fell between 2021 and 2024” is.
Pin four things in the sentence: the population covered, the period, the geography, and the unit. Record the denominator you will use and why. A fact-checker who knows the intended denominator can tell immediately whether your calculation answers the claim or a different one.
Verification check: hand the question to a colleague who has not seen your analysis. If they cannot say what result would count as a refutation, the claim is still vague.
Step 2: Record the Data Sources
For each dataset, write a source entry before you open it: publisher, original URL, publication date, the date you accessed it, file name, format, row and column counts, the geographic and time coverage, the licence terms, and known limitations. Ten minutes here saves an afternoon when the file changes under you mid-project.
Write the limitations down while the publisher’s documentation is still in front of you. The things worth capturing are the ones that will bite: a revision history where last quarter’s file got overwritten, a geographic coverage that stops at county boundaries, a collection method that changed mid-series, a variable that means something different in the codebook than in the press release.
Ask what the data does not measure, not just what it measures. Reported crime is not experienced crime; applications filed are not applications granted. That line belongs in your record, and often in your published methods note too.
Verification check: the source entry plus the URL alone lets someone else locate the identical file without emailing you.
Step 3: Preserve the Raw Data
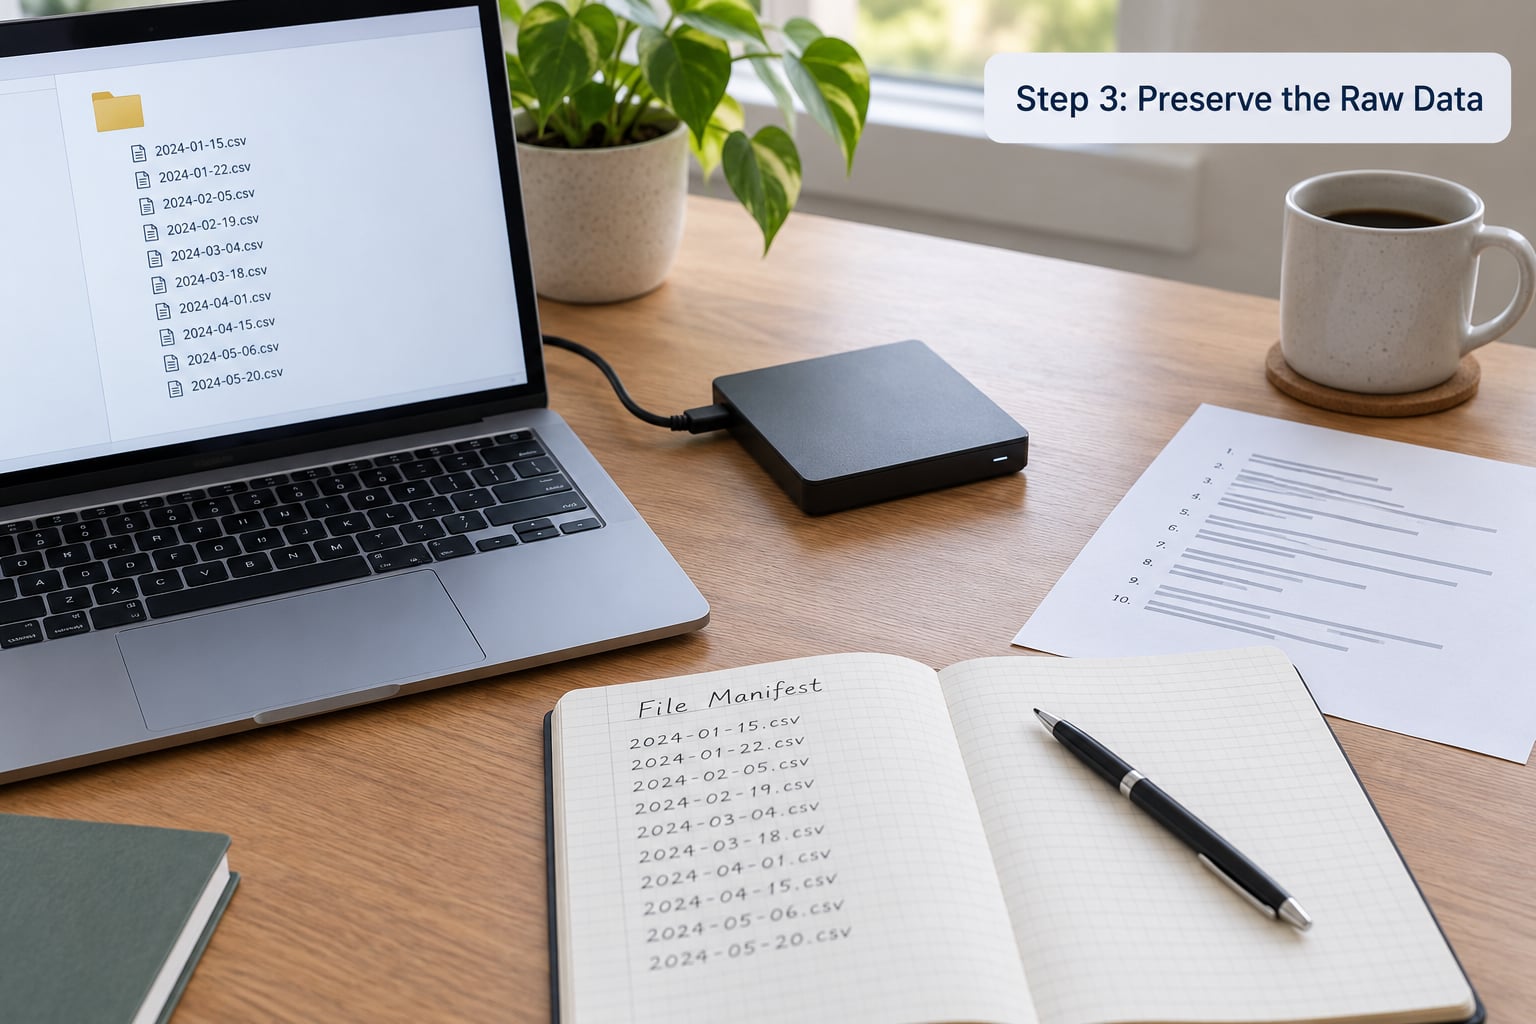
Archive an immutable copy of every source file the moment you download it, before a single edit. Keep the original filename, and never overwrite the archived copy. If the publisher revises the file next month, your snapshot is your evidence and theirs is a different dataset.
Separate raw from derived in the folder structure rather than by remembering. Something like 00_raw, 01_clean, 02_output, and 03_evidence keeps the boundary visible, and it answers the question a fact-checker asks first: which of these files is the one you actually analysed?
Two details pay off repeatedly. Record a checksum for each raw file, so you can prove later that the copy has not been altered. And keep the acquisition metadata — the request URL, query parameters, retrieval timestamp, API response headers — because scraped and API-derived files cannot be reproduced from the URL alone.
Verification check: run a checksum comparison on the archived copy at the end of the project. It should match the value recorded at download.
Step 4: Document the Method and Transformations
This is where most newsroom records fail. Someone documented that they used a dataset; nobody documented what they did to it. Getting how to document a data analysis for fact checking right comes down to this step, and the log belongs next to the code, not in a separate document that drifts out of date.
Record, for every transformation: what you did, why you did it, and the row count before and after. Cleaning decisions are where the number is really made, so they need the same treatment as the calculation itself.
- Duplicates removed: 14,203 rows to 13,988, identified by matching on name and date of birth.
- Join performed: incidents to officer records on badge number, inner join, 412 incidents with no match excluded.
- Outliers excluded: four entries above 900 units, confirmed as data-entry errors against the paper source, not real values.
- Recode: unknown ethnicity values left as unknown, not imputed, because the missingness is not random with respect to the outcome variable.
- Denominator: per-capita figures use the mid-year population estimate for the same geography, not the census count.
Note every material choice that could reasonably have gone another way, and say what the alternative would have produced. That single habit answers most of what a standards editor will ask.
Verification check: the before-and-after counts are internally consistent, and the total number of rows removed by exclusions plus the rows retained equals the input count.
Step 5: Run and Verify the Calculations
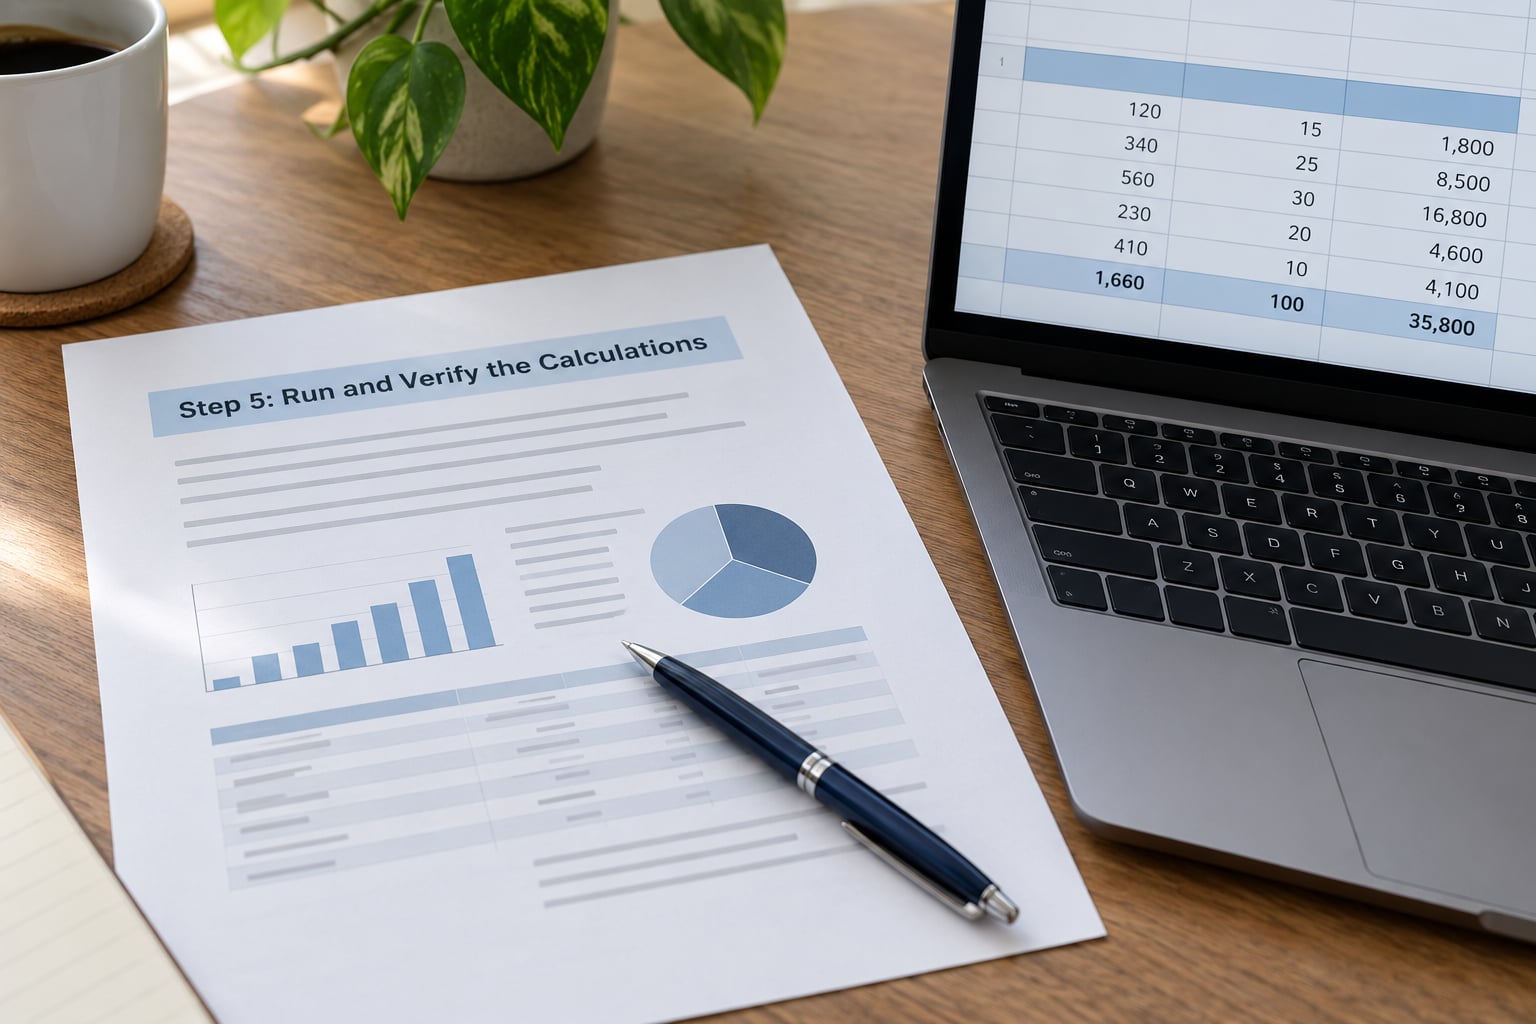
Run the analysis in a notebook or a script so the order of operations is visible, and capture intermediate results rather than only the final figure. Total records loaded, subtotal after each filter, the count in each subgroup that feeds the headline number.
Independent checks are what catch mistakes. Recalculate the key figure a second way, by a simpler method, and confirm the two agree. Test the boundary cases: the oldest record, the newest, the record with a null in every relevant field, the record that sits exactly on a threshold. Nulls deserve an explicit decision rather than a silent drop, since how you treat them often moves a percentage by more than any other choice in the workflow.
Write the rounding rule into the record. If the published sentence says 34 per cent, record the unrounded value and the rule used to get there, so a fact-checker computing from the published rounded inputs sees the same number you saw.
Verification check: rerun the notebook from the archived raw file in a clean session and confirm the headline figure is unchanged. If it changes, you have hidden state, and that is the finding, not a nuisance.
Step 6: Review Alternative Explanations and Sensitivity
Ask what else could produce the pattern you found, then test it. Swap in a second dataset if one exists. Rerun with a different time window, a different geographic definition, a different denominator, a different treatment of outliers. If the conclusion survives reasonable variation, say so in the record.
If it flips under one defensible choice, that fragility is part of the finding. Document the choice you made, the alternative, and the range the result spans across both. A conclusion that only holds under your particular specification is a weaker claim, and pretending otherwise is the kind of thing a hostile reader finds first.
Log the negative results too. The hypotheses you tested and rejected are useful evidence that the analysis was a search rather than a hunt for a number you already had, and they save the next person repeating the same dead end.
If a language model was used anywhere in the chain — generating a cleaning rule, drafting a query, extracting a figure from a document — record the model, the date, the prompt or instruction, the output, and who checked that output against the underlying source. Unlogged AI steps are the new version of an undocumented manual edit.
Verification check: state the single choice the result depends on most, and confirm you have tested a reasonable alternative to it.
Step 7: Package the Evidence and Findings
Assemble the handoff as one folder plus a one-page memo. The folder contains the archived raw files, the cleaning log, the notebook or script, the outputs, the source list, and a README explaining the order to run things in. The memo is the human-readable front door.
The memo fields I keep coming back to:
| Field | What goes in it |
|---|---|
| Claim tested | The disputed statement and the exact draft wording |
| Verdict | Supported, partly supported, unsupported, or unable to verify |
| Sources | Publisher, URL, access date, licence, file hash |
| Method | Tools and versions, filters, joins, exclusions in order |
| Key results | Headline figure unrounded, plus supporting counts |
| Uncertainty | Margin of error, confidence interval, rounding rule |
| Limitations | What the data does not measure, known gaps |
| Alternatives tested | Datasets, windows, specifications tried |
| Reviewer | Name, date, what they re-ran |
Then add the claim-to-figure map, which is the single most useful thing in the package: a list of every number in the draft, each pointing to the file and line of output that produced it. A fact-checker working through a 2,000-word story will thank you.
Keep an internal record and a public methods note separate. The internal version is exhaustive and includes everything above. The public note is short: what the data is, what period and place it covers, the main methodological choices in plain language, the known limitations, and where to get the data and code. Internal gets you verified; public gets you trust.
Before filing, decide what cannot be released. Confidential sources, embargoed material, personal data, or terms that forbid redistribution all stay internal, but say that they exist and describe them in general terms. An unexplained gap invites the reader to assume the worst.
Verification check: have the reviewer re-derive one headline figure from the package alone, with no help from you. If they cannot, the package is incomplete.
Common Mistakes
Undocumented assumptions. A filter appears with no stated reason. Fix: every filter gets a sentence explaining why it exists, written at the time you add it.
Missing access dates. A source is cited but nobody recorded when it was retrieved. Fix: the retrieval date goes in the source entry, and web-archive links where the source is likely to change.
Overwritten raw files. The downloaded file was edited in place and the original is gone. Fix: read-only raw folder, checksums recorded, derived files never saved over inputs.
Unexplained transformations. Cleaning happened in a spreadsheet with no log. Fix: a change log with before-and-after row counts, or a script with committed messages.
Screenshots as the only evidence. A cropped image of a chart cannot be checked. Fix: keep the underlying output file and the code that made it; a screenshot is a pointer to the evidence, never the evidence.
Overstated precision. A figure with three decimal places implies a certainty the data does not support. Fix: record the margin of error or confidence interval, then round to a level the uncertainty actually justifies.
Inaccessible code. The analysis lives on a laptop that was returned or wiped. Fix: archive the folder for at least as long as the outlet keeps its corrections window, and longer if a legal request is plausible.
Claims that outrun the evidence. The analysis supports an association and the draft says cause. Fix: write the strongest claim the method supports before you write the draft, not after.
A few habits pay for themselves. Keep the claim sheet open beside the analysis. Log as you go, never afterwards, because memory reconstructs your intentions rather than your actual steps. Version notebooks and commit descriptive messages, since “cleanup” tells nobody anything six months later. And treat a second pair of eyes as part of the analysis, not a courtesy: the reviewer who did not build the work is the one who spots that a column you treated as counts was percentages all along.
Frequently Asked Questions
How detailed should fact-checking documentation be?
Detailed enough that a colleague who did no part of the work can re-derive your headline figure from the package alone. That means the source URLs and access dates, every filtering and exclusion with before-and-after counts, the tool versions, the key results unrounded, and a map from each published number to the output line behind it. Prose explanation of the choices is useful, but structured fields get checked far more reliably than paragraphs.
Can I document an analysis in a spreadsheet instead of writing code?
Yes, and most small newsroom analyses are spreadsheet work anyway. What matters is that the steps are recoverable rather than that a script exists. Keep raw input sheets read-only, work on copies with descriptive file names, and maintain a change log listing each filter, formula change, and row count before and after. A pivot table you rebuilt by hand with no record of the filters is the failure mode to avoid.
What should I do if a data source cannot be shared publicly?
Keep it in the internal record and describe it rather than omitting it. State what the source is, who holds it, why it cannot be released, and what you did with it. Embargoed filings, confidential documents and data with privacy restrictions all fit this pattern. An unexplained gap invites readers to assume the least charitable explanation, while a stated restriction reads as ordinary professional practice.
How do I show that a statistical result is reliable?
Show the uncertainty and show the sensitivity. Report the margin of error or confidence interval rather than a bare point estimate, and rerun the analysis under defensible alternative specifications: a different time window, a different geographic definition, a different denominator, a different outlier rule. If the result holds across those variations, say so. If it flips under one of them, publish that too, because a result that survives only your choice of specification is not a robust finding.
Should fact-checkers publish the cleaned data as well as the raw data?
Publish the raw data wherever the licence allows, and the cleaned data alongside the code that produced it, since the cleaned version is what your figures actually rest on. Where licensing blocks redistribution, publish the derivation steps and the row counts instead so others can follow the logic. The internal record always keeps both versions whatever the public package can carry, because the audit trail matters more than the download button.
Who should review a data analysis before publication?
Someone who did not build it. An editor on the same project rarely catches the assumption you cannot see, while a colleague outside it will immediately question why the denominator is what it is. Give that person the package rather than a tour, and ask them to re-derive one headline figure unaided. In smaller outlets without a standards desk, a peer at another publication, or a data-journalism training programme, fills the same role.
Conclusion
Start with two things and the rest gets easier. Write the claim as a testable question with a stated denominator, and build a source inventory before you open the first file. Then archive the raw inputs untouched, log every transformation as you make it with before-and-after counts, run the calculation somewhere reproducible, test whether the conclusion survives a reasonable alternative, and hand over a package that lets a reviewer re-derive your headline number without speaking to you.
That record is what turns a published figure from an assertion into evidence. Write it while the work is happening, and the cost is under an hour.