
You spot errors in government data by testing the file itself, not the headline. Pull the raw table from the publishing agency, read its metadata and data dictionary, then run structural checks, reconcile the totals against the agency’s own summary, and look for values that break plausibility. Most errors in official statistics are mechanical rather than conspiratorial, and every one of those checks is something you can run yourself in an afternoon.
That is the short answer to how to spot errors in government data: verify the file, not the framing. This guide is written for journalists, newsroom data editors, researchers and auditors who need a repeatable process before a number reaches a story, a chart or an investigation. It does not assume you were trained in statistics. It assumes you want to know what to click on, in what order, and what result tells you the file is trustworthy.
One thing to keep in mind while you work: a number changing between releases is not automatically an error. Most official series get revised, and the difference between a revision and a mistake is the single biggest source of confusion for people checking government figures. The process below is built to keep those two apart from the start.
Table of Contents
- What You Need
- Step-by-Step
- Common Mistakes
- Frequently Asked Questions
- What counts as an error in government data?
- Why is government data revised after it is first published?
- Can you give me an example of incorrect government data?
- What are the most common errors in official statistics?
- How do I report an error I found in a government dataset?
- What should I do if official figures look implausibly wrong?
- Conclusion
What You Need
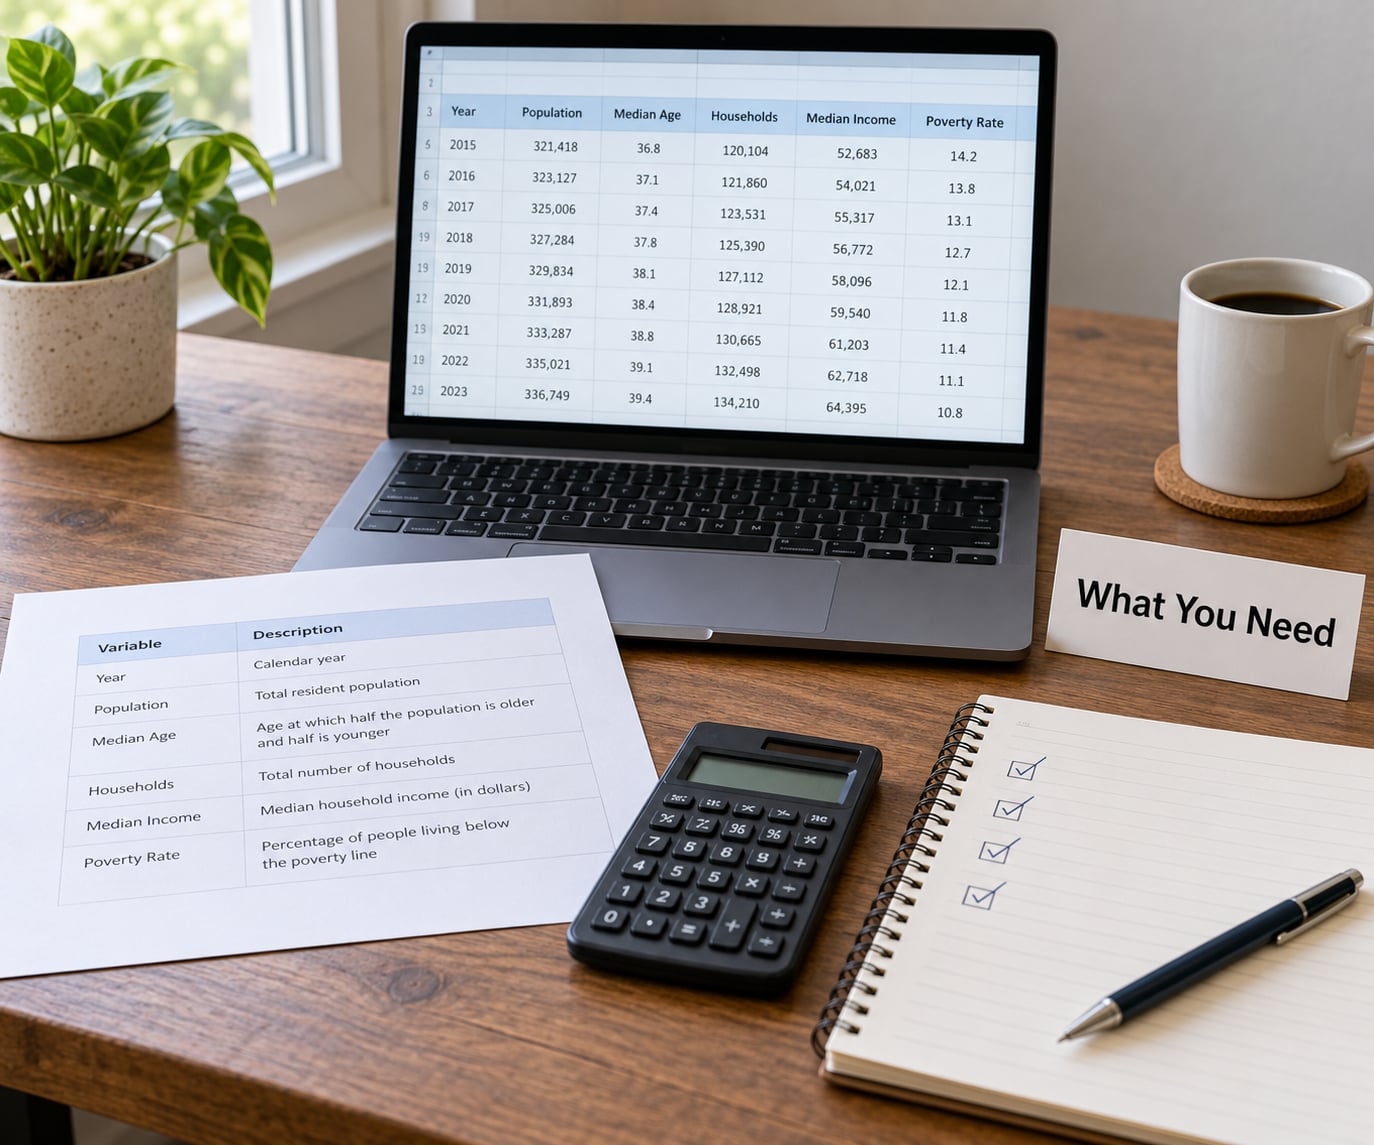
Gather this before you start. Scrambling for the missing piece halfway through an audit is how good checks get skipped.
The file itself, not the press release
Download the underlying table from the agency’s own site or open data portal rather than taking the number from a news story, a social post or a summary graphic. Save the file exactly as you received it, with the release date in the filename, and keep a copy you will never overwrite.
The metadata record
Every serious statistical agency publishes a data dictionary, a methodology note and often a quality statement alongside the numbers. These documents tell you variable definitions, measurement units, coverage limits, missing-value codes and revision history. If you cannot find them, that absence is itself a finding worth noting.
A second, independent reference
At minimum, the agency’s own summary table or PDF release of the same series. Better still, a second source: a different agency’s series on the same subject, a state or regional breakdown, or an independent economic database. You need something to compare against, and the press release is not it.
Tools
A spreadsheet application handles most of the work. A statistical programming environment such as R or Python speeds up the checks once you have more than one file, and a text editor is enough to inspect raw metadata records. A calculator is genuinely useful for the arithmetic steps, because doing a check in your head is how errors hide.
A written record
Keep a running log as you go: which file, which release date, which checks you ran, what you found. This becomes your provenance trail, and it makes rechecking before publication a two-minute job instead of a fresh project.
Step-by-Step
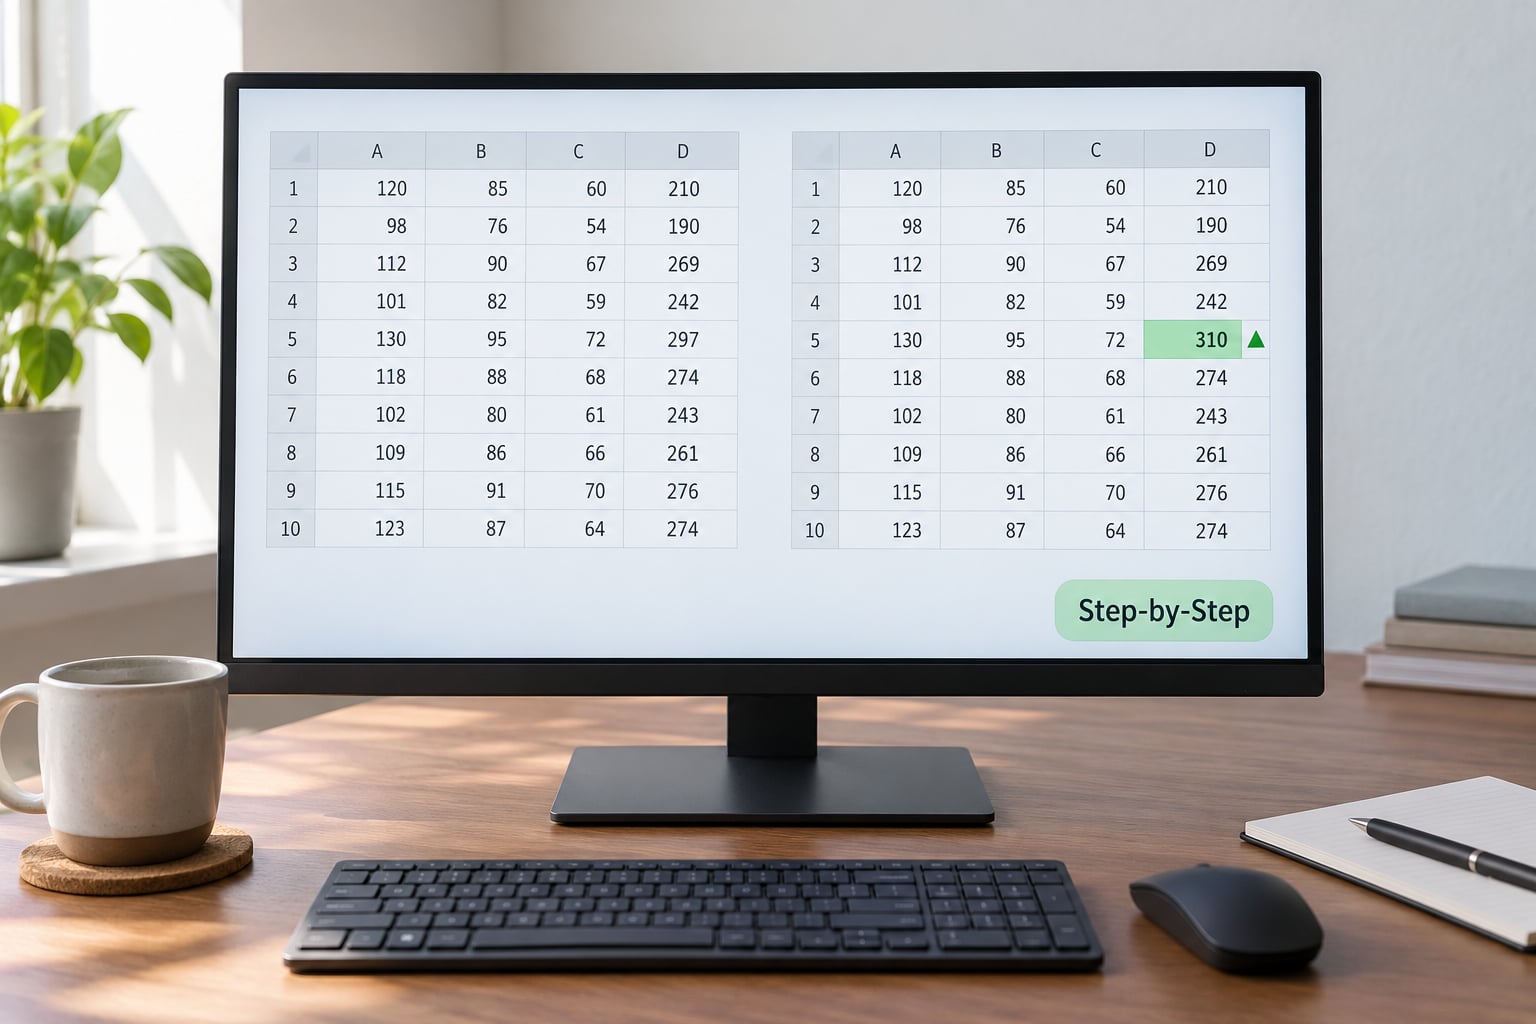
Run the six steps below in order. Each one has a mechanical action and a clear sign it worked.
1. Confirm the Source, Publisher, and Release Date
Write down the publishing agency, the exact series name, the release or reference date, the geographic scope and the collection period the data actually covers. Then establish what kind of object you are holding: an original agency file, an export from a portal, an API pull, or a copy someone else downloaded and emailed you.
That last distinction matters more than people expect. Exports quietly change formats, drop leading zeros, convert dates and truncate long numbers. A figure that arrives as 1.234E+11 instead of 123400000000 is a spreadsheet display problem, not a government error, and you need to know which one you are looking at before you accuse anyone.
Success check: you can state the vintage of the data in one sentence, and that sentence appears in your notes.
2. Read the Metadata and Data Dictionary
Open the documentation before you open the numbers. Most misreadings of official statistics come from a definitional mismatch rather than a broken value: a series labelled “persons” that counts only those actively looking for work, a change in the reference population, a unit that switched from thousands to millions mid-series.
Look specifically for four things. Definitions of every variable you plan to use. The unit of measure, stated explicitly. Missing-value codes, because -99, 999 and blank often mean “not applicable” rather than zero. And the revision history, which tells you whether the series has been redefined before.
Success check: for every figure you intend to use, you can write its exact definition in your own words without looking at the table again.
3. Check the Structure, Types, and Required Fields
Now run mechanical checks on the file. Count rows and compare against the row count the agency publishes. List the columns and confirm nothing is missing against the data dictionary. Check that identifiers are unique, that dates parse in a single consistent format, and that numeric columns are stored as numbers rather than text.
Then hunt for the failures that only appear at row level. Duplicate records. Nulls in fields the methodology says are required. Values that are negative where negatives make no sense. Percentages that sum to 103. Counts that exceed the population they are drawn from. A row dated after the release date of the file it lives in.
Success check: every structural check either passes or produces a documented explanation. Unexplained failures mean you stop and ask the agency before going further.
4. Test Totals Against the Source and Independent References
Recompute totals from the components and compare them with the headline figure in the summary release. Add up the state or regional rows and see whether the national total matches, allowing for rounding. If the agency publishes both a monthly and an annual series, check that they reconcile.
When the totals do not match, resist the urge to assume error. Rounding, netting, overlapping program populations and suppression rules for small cells all produce legitimate gaps between a total and its parts. What you are looking for is a mismatch larger than the documentation explains.
Then bring in the second source. If an independent series covering the same period and subject tells a different story, one of you has a coverage or definition difference. Working out which is the whole point of the exercise.
Success check: every headline figure you plan to publish is reproduced from a component table, or you can explain precisely why it cannot be.
5. Run Plausibility and Anomaly Checks
Plot the series over its full history and look at the shape. Real series are noisy; errors show up as a single point jumping away from the trend, a flat line where volatility is normal, or a step change that coincides with a documentation update rather than with any event in the world.
Also test for directional bias across the series, not just one point. If an agency has an incentive to make a programme look larger or smaller, the effect usually appears as a drift that starts where a methodological or political change happened. Compare levels before and after that date rather than arguing about a single month.
Finally, check the arithmetic readers will do themselves. Recompute a per-capita figure. Convert a raw count into a rate using the correct denominator. Verify that a percentage and its underlying counts tell the same story. These are the errors that survive review and reach publication, because everyone trusts the number that came straight from the agency.
Success check: you can explain every unusual value in the series, or you have flagged it as unresolved and said so in your notes.
6. Document Findings and Recheck Before Publication
Write down what you ran, what passed, what failed and how you resolved each failure. Record the exact file, the release date and the table you used, so a colleague can reproduce your work. When a figure is later revised, your notes tell you whether the change was routine or whether something was wrong to begin with.
Before the story runs, repeat the fast checks: structural validation, totals, and the arithmetic in any sentence quoting a number. Data gets edited late, charts get rebuilt from a different vintage, and a number that was correct in the morning can be stale by the afternoon. Revalidating at the last step takes minutes and catches the most embarrassing failures.
Success check: someone else on your team can reproduce your figures from your notes without asking you a question.
Common Mistakes
These are the verification errors that produce false alarms or missed ones. Each has a straightforward correction.
- Treating a missing value as a zero. Nulls in government tables often mean suppressed, not applicable, or not collected. Summing a column without handling them understates the total. Fix: find the missing-value code in the data dictionary and exclude those rows from sums and averages rather than counting them as zero.
- Comparing figures from different periods. A preliminary estimate from one release compared against a revised figure from the next looks like a swing in the data when nothing changed. Fix: pin both numbers to the same vintage and note the vintage in your copy.
- Trusting a total without checking the definitions underneath. Two series can share a name and count different populations. Fix: read the definitions before you compare anything, and state the population in the sentence where you quote the number.
- Calling every revision an error. Survey-based series, administrative records and modelled estimates all change as better information arrives. Fix: check the revision history, and separate routine revision from a documented correction or restatement.
- Losing the provenance trail. If you cannot say which file and which release date a figure came from, you cannot defend it or update it. Fix: save the original file unedited and log every transformation you apply.
- Checking only the numbers that support your story. The figure you expect to be wrong is the one you will not check properly. Fix: verify one figure that works against your hypothesis with the same rigour.
Red flags that are not errors
Some things look wrong and are not. Seasonal adjustment makes a series move against the pattern you’d expect from raw data. Rounding explains small gaps between a total and its components. Small-area estimates carry wide margins of error, so a county figure can shift a lot and still be statistically sound. Benchmark revisions restate several years of a series at once when a new survey or improved method arrives, which is why older vintages of the same series can differ from newer ones.
If you cannot find a methodology note, a revision flag or a quality statement explaining one of these, that is the finding to report, not the number itself.
Frequently Asked Questions
What counts as an error in government data?
An error is any figure the agency’s own definitions, documentation or internal totals do not support: a mislabelled unit of measure, a transcription mistake, a stale figure republished as current, or a total that does not match its components. It is distinct from a revision, which the agency publishes deliberately and documents, and from manipulation, which is a deliberate act of distortion rather than a mistake. The distinction matters because only one of the three is a correction you can request.
Why is government data revised after it is first published?
Because the first release is an estimate built from incomplete or fast-moving information. Administrative records arrive late, survey samples get refreshed, seasonal adjustment factors are recalculated, and newer methods replace older ones. Most series carry a revision policy that states how long the window stays open. The Bureau of Labor Statistics, for example, revises payroll figures for the two prior months after their first publication, and much wider benchmark revisions can restate several years at once.
Can you give me an example of incorrect government data?
In 2003 a trade publication documented that the Maritime Administration had mislabelled modal shipping fuel efficiency on a federal website, describing it as miles one ton can be carried per gallon when the figure was actually ton-miles per gallon. The underlying number also came from a 1980 study, and port authority websites had re-cited the mislabelled version. It is a clean illustration of a unit error, a stale source and error propagation in one case.
What are the most common errors in official statistics?
The most frequent are unit-of-measure mistakes, transcription and rounding slips, stale figures reused from an old study, totals that do not match their components, mismatched periods being compared, and small-area estimates quoted without their margins of error. Deliberate manipulation is rarer and harder to prove. In practice, mechanical failures account for the overwhelming majority of problems a reader will actually encounter.
How do I report an error I found in a government dataset?
Send the agency a specific, reproducible description: the file, the release date, the table, the cell or figure, and what the documentation says it should be. Include the check you ran. Ask whether the error is known and whether a correction is planned. If the response is unsatisfactory or the error is material, a records request can put your question and the agency’s answer on the public record.
What should I do if official figures look implausibly wrong?
Test them against an independent proxy before you write anything. Night-time lights and satellite measurements of air pollution have been used to estimate economic activity where official statistics are unreliable, and the comparison can show whether an activity series is overstated or understated rather than merely noisy. Describe the discrepancy as a disagreement between sources and let readers see both, rather than asserting intent you cannot document.
Conclusion
Start with the authoritative file and its metadata, not the number in someone else’s story. Read the data dictionary, run structural checks, recompute the totals, plot the series for anomalies, and log what you found. Most problems in government data are caught by those four mechanical moves, and any that survive them are worth publishing as a question rather than a claim.