
Report automation means replacing a recurring manual reporting job — pulling data, pasting it into a spreadsheet, reapplying the same formulas, emailing the result — with a scheduled script or workflow that does those steps on a fixed cadence and delivers the report without you touching it. To automate a boring reporting task, pick one weekly job, write down every step of it, build the smallest version that produces the output, and add a validation check before anything reaches a reader. Budget a weekend for the first one. Most people who look into how to automate a boring reporting task expect new software to be the hard part; it isn’t. The mapping is the hard part.
The reason this works in a newsroom is that the boring reporting tasks are genuinely boring. Same sources, same filters, same layout, same delivery list, every single week. The part that should stay human is the sentence explaining why a number moved, and the decision about what goes in front of an audience.
Table of Contents
- What You Need
- How to Automate a Boring Reporting Task: Step by Step
- 1. Choose a task that is repetitive, predictable, and low-risk
- 2. Map every input, rule, and output before opening an automation tool
- 3. Prepare and test the source data
- 4. Build the smallest automation that produces the report
- 5. Add alerts, a review step, and a manual fallback
- 6. Run it safely, observe the result, and improve it
- Common Mistakes
- Frequently Asked Questions
- Which reporting tasks are best suited to automation?
- Should journalists use a no-code tool or write a script?
- What is the safest spreadsheet automation approach for a small newsroom?
- How do I prevent an automated report from publishing incorrect information?
- How much maintenance does a reporting automation require?
- Conclusion: Start With One Small, Reversible Task
What You Need
You need six things before you open any automation tool, and four of them take an afternoon to write down.
- A task that repeats. Weekly or monthly, on a calendar, not “whenever someone remembers.”
- A written list of inputs. The exact spreadsheet, export, dashboard or URL your report reads from.
- A written output spec. The columns, the order, the chart or table format, the file name, the recipients.
- Access. Read permission on the sources, and permission to write somewhere the report can be generated. Read-only where you can manage it.
- A platform. For a spreadsheet-based report, Google Sheets with Google Apps Script is the simplest route. Zapier or Power Automate work when the data lives in SaaS tools you cannot query directly. A browser-based automation service handles pages with no API at all.
- A named human. The person who reads the output before it is distributed, and the person who gets the failure alert at 2am.
Concretely, take a Monday-morning spreadsheet report: you export a CSV from a CMS, paste it into a second sheet, apply a handful of formulas, add a total row, export to PDF and email it to a list of eight people. That is a good candidate. It is repetitive, the rules are stable, and a mistake is embarrassing but not dangerous.
A story about a city budget that gets re-pulled twice before it publishes is a bad candidate for a first attempt. The rules change mid-process and the cost of a wrong number is a correction.
How to Automate a Boring Reporting Task: Step by Step
Six steps, in order. Skipping step two is the single most common reason these projects die in week three.
1. Choose a task that is repetitive, predictable, and low-risk
The right task runs on a fixed schedule, follows the same rules every time, and fails without publishing anything wrong. Score a candidate on five things: how often it runs, how consistent the logic is between runs, how many inputs it touches, what the output looks like, and what happens if the output is wrong on a Tuesday morning.
Typical good candidates: consolidating public data from several files into one table, reformatting a recurring chart or table, pulling weekly or monthly audience and traffic numbers into a single summary, generating a corrections and retractions log from a shared sheet, and sending a finished data update to a channel. The common thread is that the output is data, and a person decides what it means afterwards.
Keep human approval on anything sensitive, anything where a definition is debatable, and anything where publishing is consequential. Verification of a source, an embargoed figure, a correction notice and a headline claim all stay with a person.
One useful filter: if you cannot describe the finished output in a sentence, you are not ready to automate it.
2. Map every input, rule, and output before opening an automation tool
Write the workflow down as a plain list: source, then field, then rule, then destination. People who write automation docs for practitioners repeat the same advice in forum threads — map the manual workflow first, automate in small steps, and validate each stage as you go. The map is also your rollback plan, because it is the only record of what the process was supposed to do.
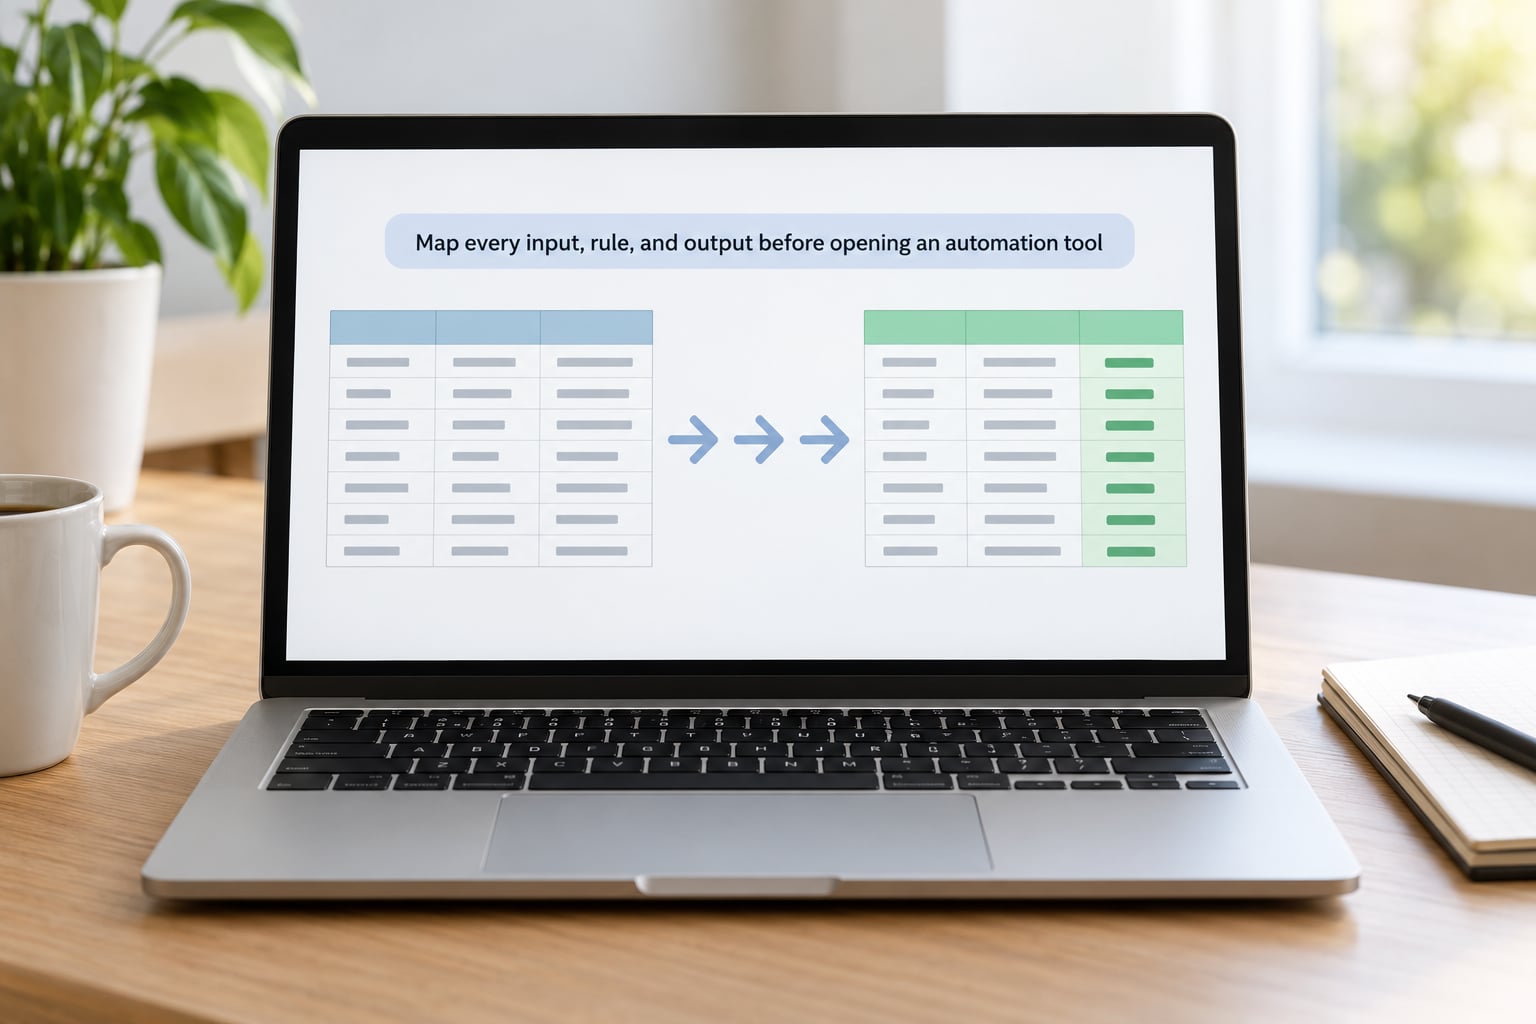
For the spreadsheet example, the map reads like this: the CMS export CSV supplies date, section, author and page views; drop rows with a blank date; standardize the section labels to the six desk names; compute views per story; sort by date descending; write a total row; render a PDF; email the eight addresses on the distribution list.
Then take the last three reports you produced by hand and compare them against the map. Anywhere the real work deviated from what you would have predicted, that is a rule you did not know you had. Those are the ones that will break the script at 6am on a Monday, and they belong on the map before the code, not after it.
Finish by writing the acceptance test: a known-correct manual report you will compare every automated output against, and the number that must always be true — for example, that the row count in the output is at least 90 percent of the row count in the source.
3. Prepare and test the source data
Most broken automations are not broken code. They are a source file where one date reads 03/04/26 and another reads 2026-04-03, or where a desk is labelled “Politics,” “politics” and “POLITICS” in three different weeks. Standardize those before anything else: one date format, one label list, one number format, one identifier scheme, and no trailing spaces.
Then remove the rows you have been deleting by eye. Blanks, duplicates, test entries left over from a query, the copy of last week’s file someone dropped in the folder. Give that removal a written rule, because a human deleting three obvious rows is different from a script deleting three hundred.
On the Google Sheets route, the source preparation happens in the sheet itself: a column for a cleaned date, a lookup table mapping every raw desk label to a standard one, and a small test tab holding three weeks of known data. In the Google Sheets desktop or web editor the Apps Script route is Extensions, then Apps Script, which opens a separate script editor pane beside the sheet; the menu labels and layout can differ by account, device and future product changes, so check what your version shows before following along. Start with the test tab, not the live one.
How to automate a boring reporting task safely depends on this step more than any other. A script pointed at clean, tested data fails loudly and obviously. A script pointed at raw exports produces a plausible, wrong report, which is worse.
4. Build the smallest automation that produces the report
Write the logic in plain language first, in three or four sentences. Read every row from the source. Drop rows where the date or the identifier is missing. Compute the reporting field for the rows that remain. Write a clean table to a new file. Anything beyond that is a feature you do not need yet.
Here is that logic as a short, readable Python script using pandas. It is a complete example rather than a fragment: it loads, filters, computes, validates and writes.
import pandas as pd

SOURCE = "exports/cms_weekly.csv"
OUTPUT = "reports/weekly_summary.csv"
MIN_ROW_RATIO = 0.9          # output must keep at least 90% of source rows
REQUIRED_COLUMNS = ["date", "desk", "author", "views"]

# 1. Load the source export
df = pd.read_csv(SOURCE)

# 2. Standardise: parse dates, trim text, normalise desk labels
df["date"] = pd.to_datetime(df["date"], errors="coerce")
for col in ["desk", "author"]:
    df[col] = df[col].astype(str).str.strip().str.title()
df["desk"] = df["desk"].replace(DESK_LABELS)   # dict mapping raw labels to desk names

# 3. Drop rows that cannot be reported on
before = len(df)
df = df.dropna(subset=REQUIRED_COLUMNS)
df = df.drop_duplicates(subset=["date", "author", "desk"])

# 4. Compute the reporting field
df["views"] = pd.to_numeric(df["views"], errors="coerce").fillna(0)
summary = (
    df.groupby(["date", "desk"], as_index=False)
      .agg(stories=("author", "count"), views=("views", "sum"))
      .sort_values(["date", "views"], ascending=[False, False])
)

# 5. Validate before writing anything
if len(df) / before < MIN_ROW_RATIO:
    raise ValueError(
        f"Too many rows discarded: {len(df)} of {before} rows survived. "
        "Check the date parsing and desk labels before running again."
    )
if summary.empty:
    raise ValueError("Report is empty. Do not send it.")

# 6. Write the output
summary.to_csv(OUTPUT, index=False)
print(f"Wrote {len(summary)} rows to {OUTPUT}")
Two things to notice. The script refuses to produce anything when too many rows are discarded, which is how a broken date format announces itself on day one rather than in front of your editor. And the desk labels go through a dictionary you control, so a new label appears in the output as something obviously wrong instead of quietly creating a seventh desk.
You can run the same logic in Google Apps Script instead. Sheets has a built-in function for reading a range and a built-in function for writing one, plus a mail function for delivery and a trigger that fires on a schedule. The structure is identical — filter, compute, check, write — just shorter, and the whole thing lives in a tab of the sheet your team already has open.
5. Add alerts, a review step, and a manual fallback
An automation that emails a report nobody checked is worse than the manual version, because the manual version at least had a human staring at it. The delivery step should be a draft, not a send, until someone approves it.
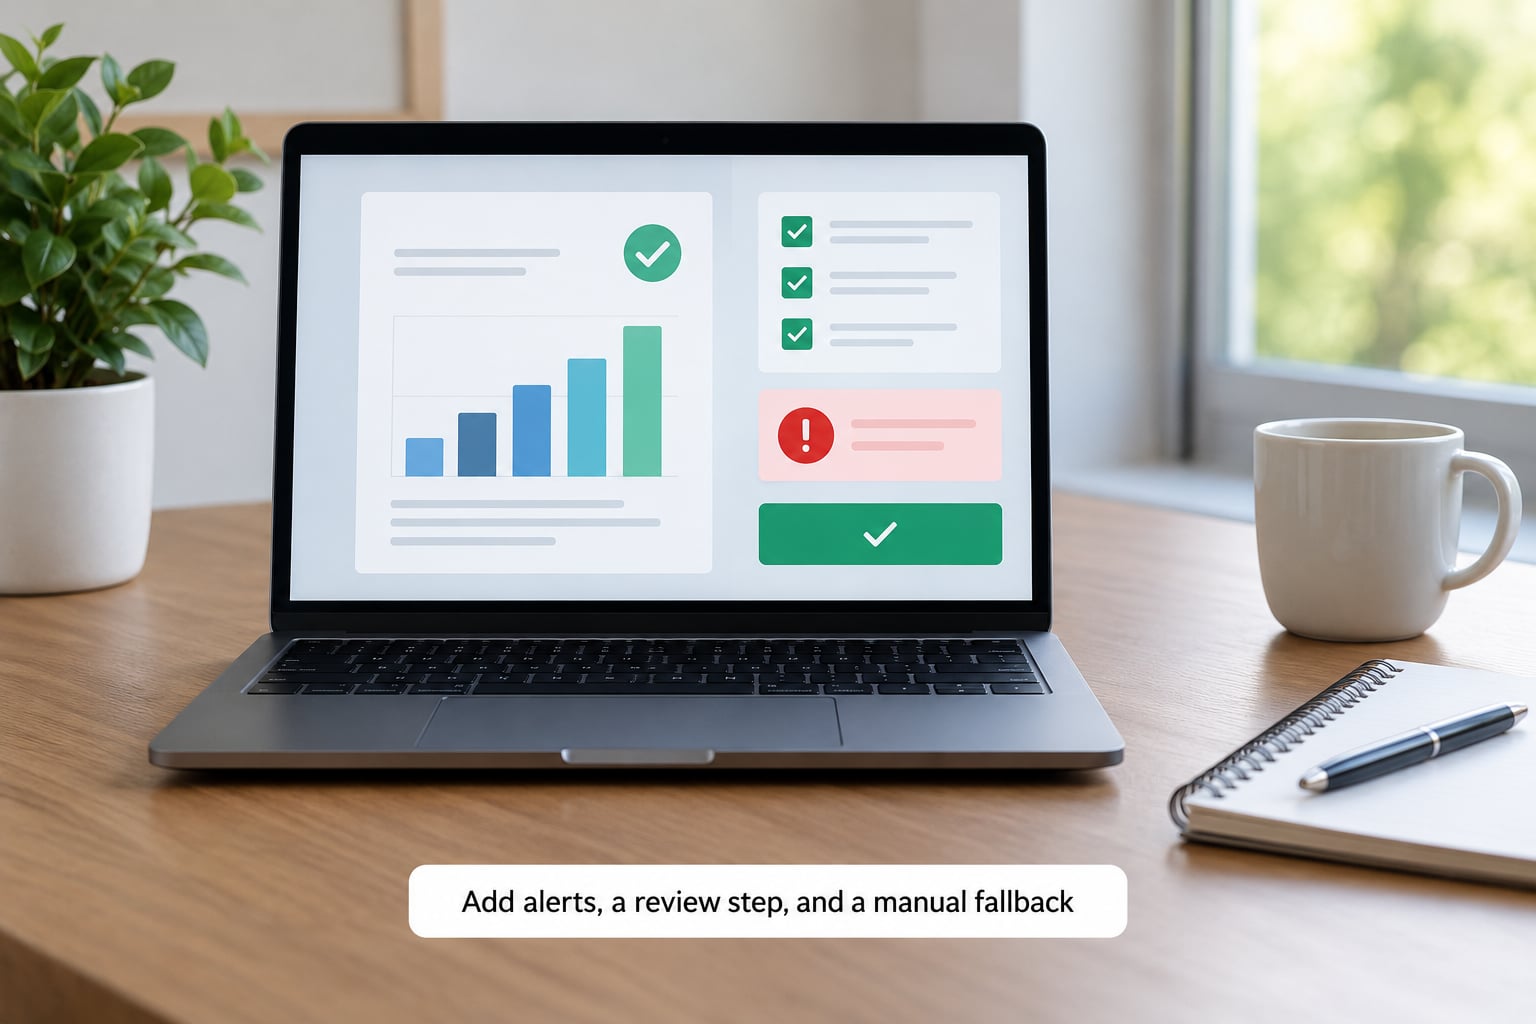
Every finished run should do three things: write the output to a dated file so last week’s version still exists, send a short message with the row count, the date range and the destination, and raise an alert that a human actually reads. That message is also your audit trail — when someone asks why last Thursday’s number was different, you have the run record.
Then write the fallback before you need it, because you will need it within a month. Missing data, a source that changed its format, a credential that expired, a run that simply failed. The rule should be short: if the validation check fails, no report goes out, the alert says what failed, and the reporter produces the manual report that day. A stalled automated report is an inconvenience. A wrong automated report that goes out quietly is a correction.
Keep credentials out of the script and out of the spreadsheet. Use the platform’s own secret or credential store where it exists, and give the job the narrowest permissions that work — read on the source, write only on the report folder.
6. Run it safely, observe the result, and improve it
Do not switch over on day one. Run the automation and the manual process in parallel for at least two cycles and compare the outputs line by line against the known-correct report from step two. Where they differ, you have found either a rule you missed or a bug — both are cheap to fix now and expensive later.
Then test the edges on purpose: a week with zero rows, a week with one row, a row with a missing author, a date in two different formats, a desk label nobody has used before. Feed those in and watch what the script does. A script that handles the empty week by raising an error is working correctly, and that is the behaviour you want.
After that, watch a handful of runs rather than one. Confirm the schedule actually fired, the output arrived, the row count is plausible and the alert path works — send yourself a test failure and check you get it. Decide in advance what happens next: repair and resume, pause and fall back to manual, or retire the automation. Retiring is a legitimate outcome when stakeholders stop reading the report, and it is a good moment to delete a report nobody needs.
Common Mistakes
- Automating a process that is still changing. Wait until the rules have held for two or three cycles. Fix the disagreement about the definition first, then automate.
- No exception handling. Wrap each stage so a failure stops the run with a message naming the stage, instead of producing an empty file that emails successfully.
- Credentials in the script or the sheet. Anyone with the file has the key. Use the platform’s credential store and rotate anything that has been pasted in a chat message or committed to a public repository.
- Destructive write permissions. Read on sources, write only to the report output. A job that can edit the source will eventually edit the source at the wrong moment.
- Untested edge cases. Empty weeks, single-row weeks, missing fields and new labels break naive scripts. Test them on purpose, once, before you rely on it.
- One source of truth for everything. If every number in the report comes from one export, one broken query ruins the whole thing. Cross-check the headline figure against a second source.
- Treating the output as approved. The automation moves data. A person reads it, decides what it means and signs it off. Keep that step in the workflow.
- No documented owner. Write down who maintains the job, where the code lives and who gets the alert. Undocumented automations get deleted by whoever inherits the account.
Two habits close most of these gaps: keep the manual process documented and runnable until the automated one has proven itself over several cycles, and never add a second task to the same workflow before the first one has survived a month without a surprise.
Frequently Asked Questions
Which reporting tasks are best suited to automation?
The best candidates repeat on a fixed schedule, follow identical rules each cycle, and end in a data product rather than a judgment. Consolidating several public data files into one table, reformatting a recurring table or chart, pulling weekly audience numbers into a summary, and generating a corrections log all fit. Keep source verification, embargoed figures, corrections and any framing decision with a person.
Should journalists use a no-code tool or write a script?
Start no-code. If the report already lives in a spreadsheet, Google Sheets with Apps Script will handle filtering, computing, writing a PDF and emailing it, and you stay inside tools your colleagues can open. Move to Python with pandas when the report has more than a few data sources, when you need tests and version control, or when a second person will maintain it. A tool that only one person understands is not maintenance, it is a dependency.
What is the safest spreadsheet automation approach for a small newsroom?
Getting how to automate a boring reporting task right starts by keeping the spreadsheet as the source of truth and adding a script beside it rather than replacing it. Give the script read-only access to the data, write the report to a separate dated output, and turn delivery into a draft that a person approves. Store credentials in the platform’s credential store rather than in the sheet, and name one person as owner and one as the alert recipient.
How do I prevent an automated report from publishing incorrect information?
Validate before delivery, not after. Check that the row count is plausible against the source, that the date range covers what you expect, that no required field is empty, and that the report is not empty. If any check fails, send nothing and raise an alert that names the failed check. Cross-check the headline figure against a second source, and keep a human approval step before anything reaches an audience.
How much maintenance does a reporting automation require?
Budget an hour a month for a stable report whose sources rarely change, and more when a source reformats its export or a credential expires. Most failures are source changes rather than logic bugs, so checking the row-count and date-range numbers on each run catches them early. Document the workflow, keep the manual version runnable for a few cycles, and write down who owns the job before you rely on it.
Conclusion: Start With One Small, Reversible Task
Pick the weekly task that annoys you most and that you can rebuild by hand in under an hour. Write down its inputs, rules and output, standardize the source, and build the smallest version that produces the report — nothing else.
Run it beside the manual version for a couple of cycles, add the validation check and the human approval step, and expand only once the numbers match. The goal is not to automate reporting. It is to get the boring 80 percent off your desk so you have the time to write the sentence that explains what the numbers mean.