Learning how to work with shapefiles for beginners comes down to one rule: never move, rename or send a single file on its own. A shapefile is a small family of files — .shp, .shx, .dbf and usually .prj — that share one base name, and every tool reads them together as a single layer. Get that habit right and the rest is QGIS or half a dozen lines of GeoPandas.
A shapefile is an ESRI vector file format that stores geographic features — points, lines or polygons — alongside their attribute data, split across a group of files with the same name and different extensions.
That format is still the default exchange for open data. Most government open-data portals, ArcGIS Online layers and newsroom downloads hand you boundary, postcode or road-network files in shapefile form, which is why so many first mapping projects start here. If you have ever downloaded a zip, double-clicked the .shp and got an empty screen, you have hit the exact problem that trips up nearly everyone new to it.
The workflow below is the one I keep coming back to in newsrooms: keep every companion file together, check the coordinate system before you style anything, read the attribute table before you trust it, then export. It takes an afternoon the first time and about ten minutes after that.
Table of Contents
- What You Need
- How to Work with Shapefiles for Beginners
- 1. Choose a shapefile and keep its supporting files together
- 2. Inspect the layers, fields and geometry in QGIS
- 3. Check and assign the coordinate reference system
- 4. Fix common geometry and attribute problems
- 5. Select, filter and combine shapefile data
- 6. Export a clean map or data file
- 7. How to work with shapefiles for beginners in Python
- Common Mistakes
- Frequently Asked Questions
- Conclusion
What You Need
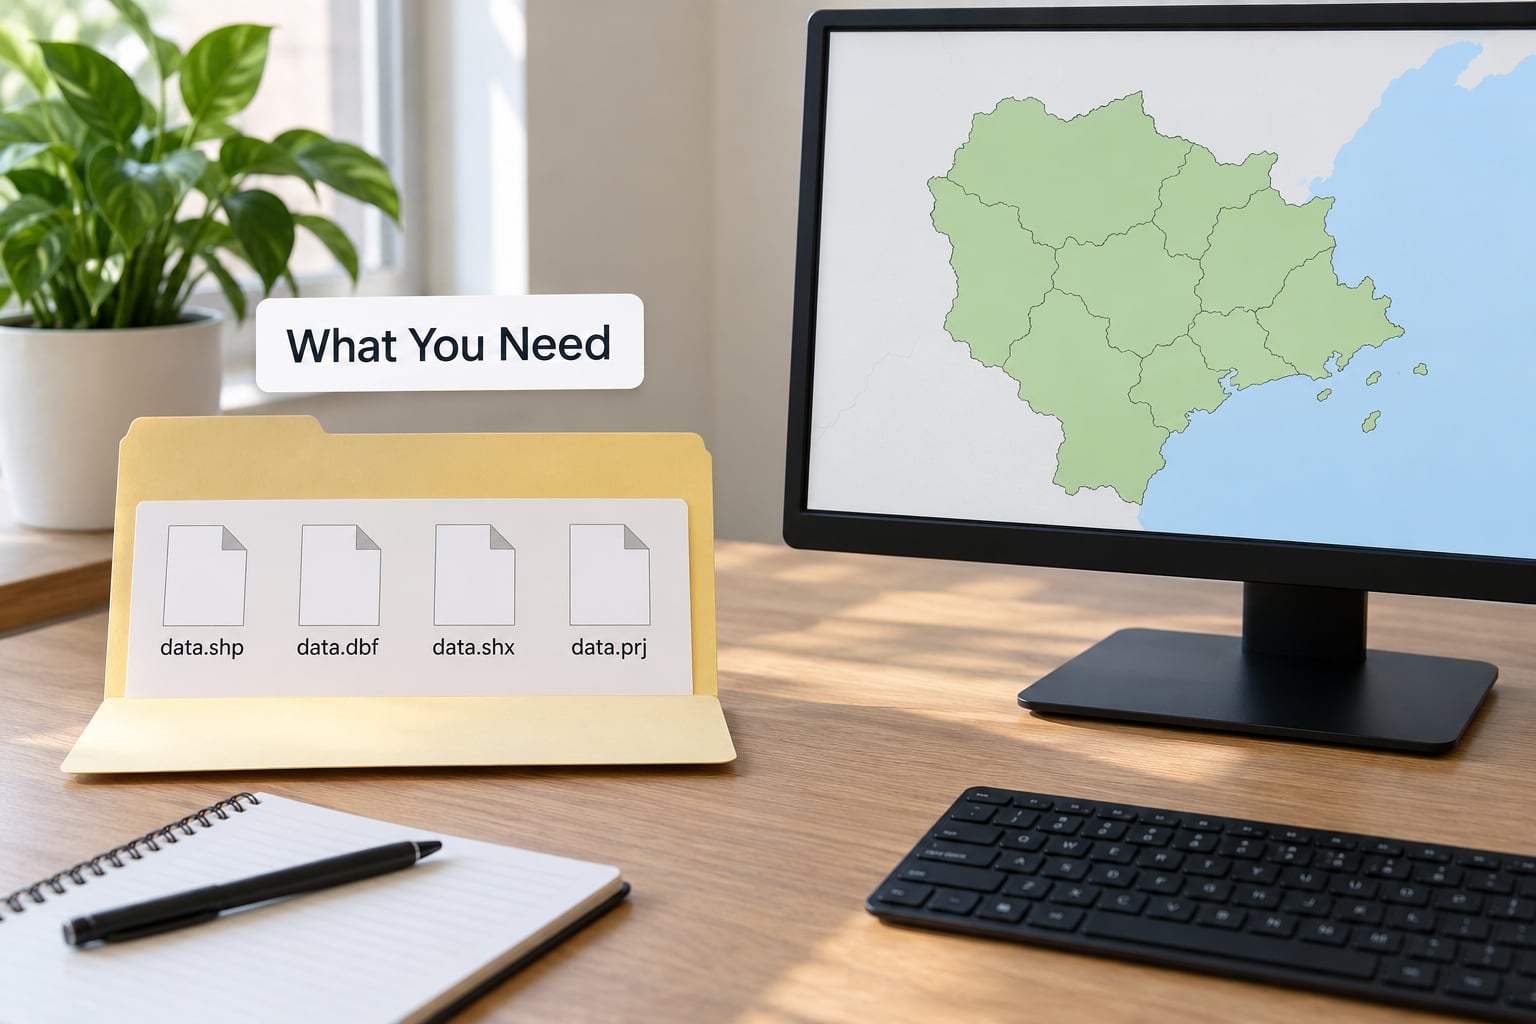
A shapefile is one dataset wearing four or five hats. Before touching anything, know which file does what, because a missing one is the reason a layer refuses to load.
- .shp — required. The geometry: every vertex, coordinate by coordinate.
- .shx — required. An index that tells software where each feature begins and ends inside the .shp.
- .dbf — required. A plain dBase table holding one row per feature: the attribute table you see in QGIS.
- .prj — treat as required. A one-line text file recording the coordinate reference system. Without it, software guesses, and guesses put your map in the ocean.
- .cpg — optional but common. Declares text encoding for the .dbf so accented place names do not turn into mojibake.
- .sbn, .qix, .fix — optional index files that speed up spatial queries. They can be rebuilt.
All of them share the same base name: districts.shp, districts.dbf, districts.prj. Rename one and the dataset breaks. That is why the file group travels as a zip, every time.
Tools that do the job
QGIS 3.x is the default choice for a beginner. It runs free on Windows, macOS and Linux, it opens a .shp by drag and drop, and it handles the fixes below through a menu. Community answers on r/QGIS almost always point new users there first, and it is the tool I suggest to any reporter who has never done mapping before.
A text editor — VS Code, or anything that shows a file’s contents — lets you read the .prj line and the .cpg contents directly. When QGIS guesses a projection wrong, that file tells you the truth in one line of plain text.
GeoPandas 1.x handles the same files from Python, with Shapely 2.x underneath for geometry. Worth learning once you need the same map regenerated every week rather than rebuilt by hand.
A practice dataset: download a country or admin-1 boundaries set from Natural Earth, which publishes clean shapefiles with full attributes, or pull a neighbourhood boundary set from your own city’s open-data portal. Use it to follow along before you touch anything a source gave you.
How to Work with Shapefiles for Beginners
The full beginner workflow in six QGIS steps, plus the same thing in Python for when you need it repeatable. Skip to the numbered heading you need.
1. Choose a shapefile and keep its supporting files together
Download the dataset and unzip it into its own folder on your drive, not into Downloads alongside everything else. Then open that folder and check the file names yourself: you should see matching .shp, .shx, .dbf and .prj files. If only a .shp arrived, the archive was incomplete or someone sent you one file out of the set — go back to the source.
Rename the whole folder rather than any file inside it, and never edit the files directly. Make a copy for your working version. Every beginner shapefile workflow worth copying starts the same way, with a read-only original and a working duplicate sitting beside it. People regularly ask on r/gis how to keep a layer for later use in a project; the answer is a copy plus a saved QGIS project, not edits to the download.
One more habit worth building: zip the folder contents whenever you send it on. Uploading a bare .shp to ArcGIS Online or emailing one to a colleague is the single most common failure, and r/ArcGIS threads about it repeat the same fix over and over — upload the zip, let the platform unpack it.
2. Inspect the layers, fields and geometry in QGIS
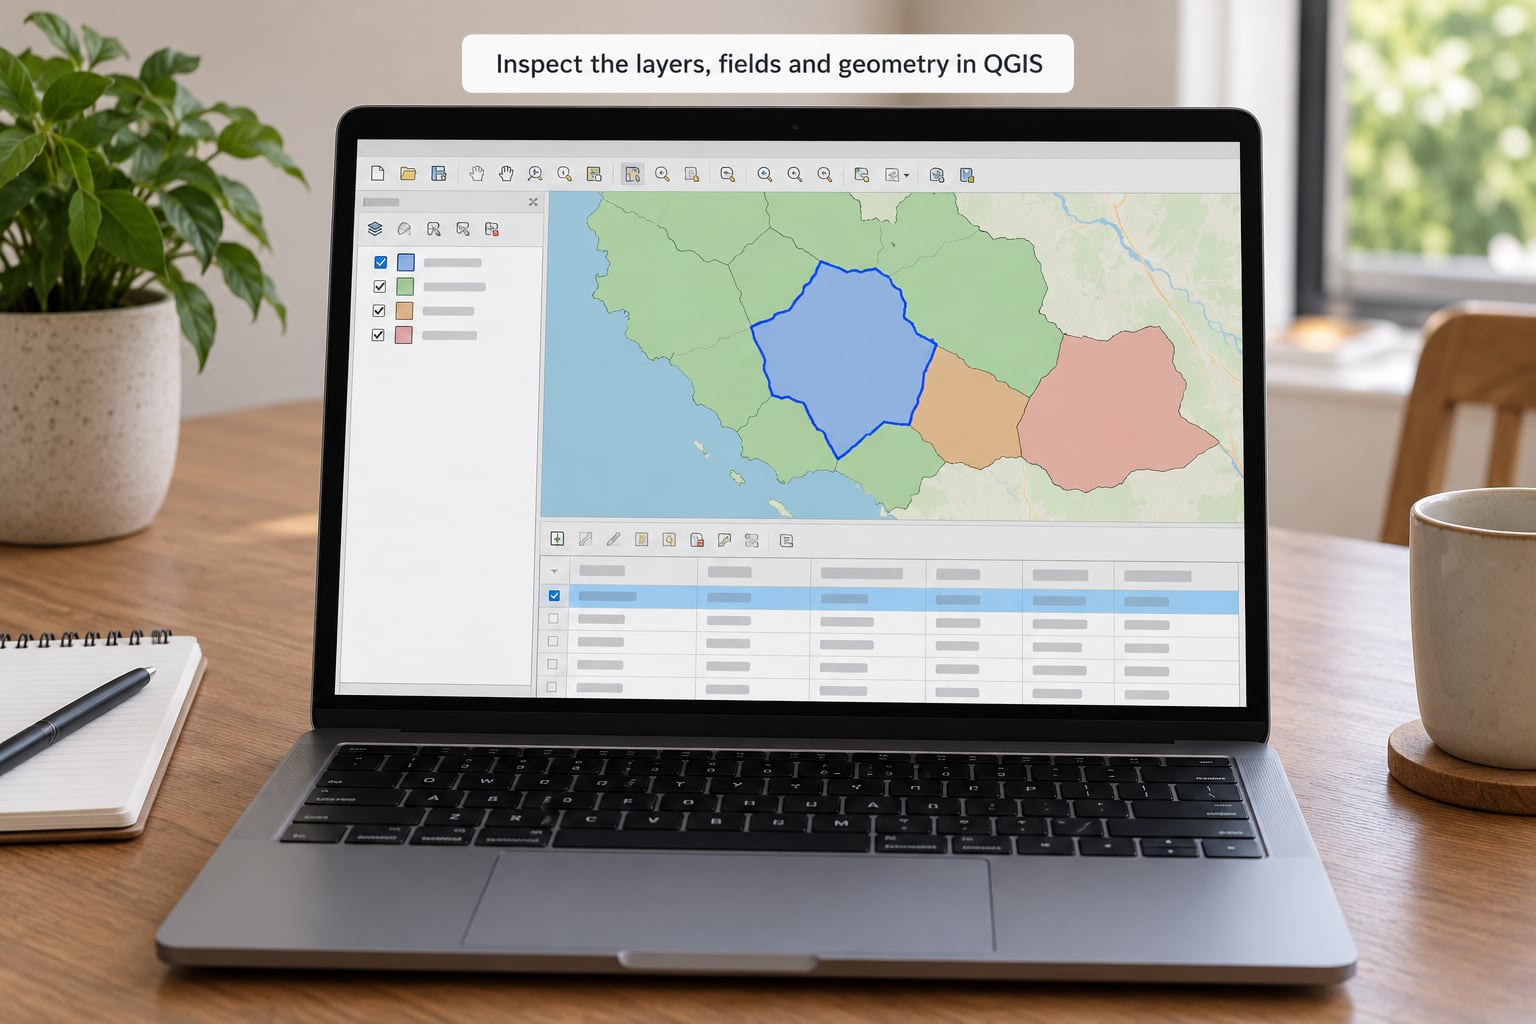
Open QGIS 3.x and start a new project. Drag the .shp file from your file browser straight onto the map canvas — it loads with a default style, and the layer name appears in the Layers panel on the left.
If drag and drop does nothing, use the menu path instead: Layer > Add Layer > Add Vector Layer, set Source to your .shp file, then click Add. Either route gives you the same layer.
Now spend two minutes looking before you style anything:
- Right-click the layer and choose Zoom to Layer. Features should land in a recognisable place. A layer sitting in the middle of the ocean is a projection problem, not a broken download.
- Open the attribute table with Layer > Open Attribute Table. Check the feature count against what the data provider promised, and read the field names. These are the columns you will join your own numbers to.
- Look at the geometry. Points are single markers, lines are strokes, polygons are filled shapes with area. One shapefile holds one geometry type — a file mixing points and lines is not a shapefile, whatever its extension says.
How you know it worked: colours fill sensible shapes, the attribute table rows match the shapes on screen, and the feature count is plausible. Anything else stops here, before you have invested in a style.
3. Check and assign the coordinate reference system
Projection is where beginners lose an afternoon. Open Layer Properties > Source and look at the Coordinate Reference System field. QGIS reads it from the .prj file; if it says something like “Undefined” or an unknown authority, the .prj is missing or corrupt.
Find out what it should be before you assign anything. The data provider’s documentation usually states the EPSG code, and the .prj file is a single readable line you can open in a text editor. The most common case: boundary files ship in WGS 84 (EPSG:4326), which uses degrees for latitude and longitude.
Set the CRS in Layer Properties > Source, or for a wider fix, Project > CRS to set it for the whole project. Then zoom to the layer again.
How you know it worked: Zoom to Layer puts your shapes over the coastline or region you expect. If they are off by a consistent offset, a datum mismatch rather than a projection guess is the likely culprit, and the data provider’s documentation is where to confirm it.
When you measure distance or area, switch to a projected CRS for that region. Degrees are not metres.
4. Fix common geometry and attribute problems
Self-intersecting rings and unclosed polygons are normal in real open data. QGIS 3.x fixes them through Processing > Vector Geometry > Fix geometries (in older versions: Vector > Geometry Tools > Fix geometry). Run it, then check that the feature count has not changed unexpectedly and that the shapes still render.
Empty or unwanted features are a selection problem rather than a bug. Use Select Features by Expression (the funnel icon in the attribute toolbar) and write something like "COUNT" IS NULL or "AREA_ID" <> 'A99'. Preview the selection, confirm the highlighted rows are the ones you mean, then right-click the layer > Remove Selected Features.
Garbled attribute values — é instead of é — mean the encoding file is missing. Add a .cpg file next to the .dbf containing the correct code page, then reload the layer. UTF-8 works for most modern open data; older European datasets often need something else.
Test the cleaned layer before analysis: reload it, zoom to it, and scroll the attribute table for a few rows. If it survives that, it is ready.
5. Select, filter and combine shapefile data
Filtering by attribute is how you cut a dataset down to what a story needs. Right-click the layer > Filter > Filter Features and enter an expression in the panel that opens, such as "REGION" = 'North' or "POP_2024" > 50000. The map updates as you type. Filter shows and hides; it does not change the data on disk.
To build a new dataset, export the selection instead. Right-click the layer > Export > Save Selected Features As, pick a folder, name the output, and choose the format. Your source layer stays untouched.
Merging is straightforward when the layers share a CRS and a schema. Processing > Vector generalisation > Merge vector layers takes several inputs and writes one output. Dissolving is different: Processing > Vector geometry > Dissolve flattens many features with a shared category into one, which is how you turn district polygons into a single region outline.
To attach your own spreadsheet to the shapes, use Processing > Vector generalisation > Join attributes by field. Match the CSV key to a field of identical type — a text key will not match a numeric one. This is a table lookup, not a spatial join: Join attributes by location is the one that works out which polygons contain which points.
6. Export a clean map or data file
Three exports cover most work, and they are different jobs.
Save the project so your styling, layer order and CRS are reusable. File > Save As, give it a .qgz name. The project references your shapefile, so keep that folder where it is or the layers will show as missing paths.
Export an image for a newsroom graphic via Project > Export Layout as Image. Build the layout first under Project > New Print Layout, where you set page size, legend, title and scale bar, then export as PNG or PDF at a resolution the publication accepts. SVG is the safe choice if a designer will restyle it.
Export the data as GeoJSON when you are handing the layer to a web map or a colleague who does not use GIS. Right-click the layer > Export > Save Features As, then choose GeoJSON. GeoJSON needs no companion files, which removes the entire zipping problem, though field names and coordinate precision deserve a glance before you publish it.
Save a copy as GeoPackage too if the project will grow. It holds layers, styling and indexes in one file, keeps full field names and has no 2 GB size ceiling. ESRI has recommended moving away from shapefiles for new work since 2020, so it is a sensible default for anything you expect to revisit.
7. How to work with shapefiles for beginners in Python
The QGIS steps above map almost one-to-one onto GeoPandas. Install it with pip install geopandas, open a Jupyter notebook, and read the folder you unzipped earlier:
import geopandas as gpd

districts = gpd.read_file("data/districts/districts.shp")
print(districts.shape)
print(districts.crs)
print(districts.head())
That returns a GeoDataFrame: the shapes in a GeoSeries column named geometry, the .dbf contents as ordinary columns, and the .prj read into .crs. Three checks confirm the read worked: shape gives rows and columns, crs prints something like “EPSG:4326” rather than None, and head() shows your real fields.
The rest of the workflow reads naturally:
districts = districts.to_crs("EPSG:3857")          # reproject
north = districts[districts["REGION"] == "North"]   # filter
north.to_file("north.geojson", driver="GeoJSON")    # export

gpd.sjoin(points, districts, predicate="within")    # spatial join
Two version notes matter for beginners copying older tutorials online. Current GeoPandas 1.x uses pyogrio or fiona under the hood, and Shapely 2.x removed geometry accessors such as x.exterior.coords — plenty of pre-2023 blog posts show code that no longer runs. The R tutorials that dominate older results rely on the maptools and rgeos packages, which are retired.
How you know it worked: print the result. A written notebook where every step shows its own output is the fastest way for a colleague to check your work six months later.
Common Mistakes
Nearly every beginner shapefile failure falls into one of these eight buckets, and most surface inside the first hour of learning how to work with shapefiles for beginners. The error text is what you will actually see in QGIS, Python or a web map.
Only one file was uploaded or sent. The layer opens empty, or ArcGIS reports it cannot locate the source. Upload or send the whole folder zipped. This is the single most common cause, and r/ArcGIS and r/gis threads about unlocatable layers all resolve the same way.
Features appear in the wrong place. A missing, wrong or mismatched .prj. Read the file in a text editor, compare it with the provider’s stated EPSG code, set the CRS in Layer Properties > Source, and save the project.
Accented names come out as é or similar. The .dbf encoding is undeclared. Add a .cpg file beside the .dbf, or pass the encoding explicitly when reading with GeoPandas.
Attribute values show in the wrong order or wrong columns. Field names were truncated to 10 characters, a hard limit of the .dbf format. Treat the truncated names as final and join your own data using them; convert to GeoPackage if you need longer names.
A layer opens read-only or refuses to save. The files came from a read-only location or an archive with restricted permissions. Copy the folder somewhere you own before editing.
Two different layers refuse to merge. Different CRS values, or mismatched field names and types. Reproject both to the same CRS first, then align the schema in the merge tool.
Geometry errors, spikes or null shapes. Run Fix geometries from the Processing toolbox, then use Processing > Vector geometry > Check validity to see what is left.
A file will not open in an online map. Web mapping libraries often need GeoJSON or GeoPackage rather than shapefiles, because a shapefile is several files and one upload will not carry them all.
Before you publish anything, run this short checklist:
- Does the folder still contain .shp, .shx, .dbf and .prj with one matching name?
- Is the layer in the coordinate reference system the source documented?
- Does the feature count match what the data provider published?
- Do place names in the attribute table read correctly?
- Does Zoom to Layer land on the right part of the world?
- Are the source files unmodified, with your work saved as a project or a new export?
Frequently Asked Questions
What is a shapefile, and can you give me an example?
A shapefile is an ESRI format that stores vector features — points, lines or polygons — plus their attribute data in a group of files sharing one base name. A common example is a country boundaries file from Natural Earth, where each row holds one country with fields for its name, population and region, and each shape is the country’s outline.
How do I open a shapefile in QGIS?
Open QGIS 3.x and a new project, then drag the .shp file from your file browser onto the map canvas. If nothing loads, use Layer Add Layer Add Vector Layer, choose Source, select the .shp file and click Add. Keep the .shx, .dbf and .prj files in the same folder as the .shp, or the layer will load with no shapes and no attributes.
How easy is QGIS to learn for a complete beginner?
Enough to open a shapefile and make a first map in an afternoon. The interface looks dense, but the daily path is short: add a layer, open the attribute table, style by a column, export an image. Community beginners on r/QGIS usually master those five actions first, then add Processing tools and joins later once the basics feel routine.
How do I read a shapefile in Python?
Use GeoPandas: call gpd.read_file on the .shp path and you get a GeoDataFrame. The .crs attribute reports the coordinate reference system read from the .prj, and the geometry sits in a GeoSeries column called geometry. Check shape, crs and head() before you go further, since an empty result almost always means a missing companion file.
Why are my attributes showing as strange characters?
The .dbf file has no declared text encoding, so software guesses and mangles accented letters. The fix is a .cpg file next to the .dbf declaring the right code page — UTF-8 for most modern open data — then reload the layer. Older European datasets may need a different code page, which the data provider’s documentation usually names.
Are shapefiles still used, or should I use a newer format?
Yes, they remain the most common exchange format for open data, so you still need to open them. For new projects, GeoJSON suits web maps and GeoPackage suits desktop work: one file, full-length field names, styling and indexes included, and no 2 GB size limit. Convert on import and keep the shapefile only for interchange.
Conclusion
Start with three things before you edit or publish anything. Keep every file of the shapefile in one folder and send it zipped. Open the .prj and confirm the coordinate reference system against the source documentation. Then open the attribute table and read the feature count and field names out loud.
Those three checks catch nearly every problem beginners hit, and they take about five minutes. Once a layer passes them, opening, styling, joining and exporting all follow from QGIS 3.x or a short GeoPandas script, and you can put your time into the map itself. That is the whole of how to work with shapefiles for beginners without losing an afternoon to a missing file.