
Checking a source dataset against reality means comparing what its records claim happened with independent evidence of the actual entities, events or totals those records describe. In practice you pick a sample of records, turn each one into a checkable real-world claim, then look for corroboration from a second source or from direct observation. Records that survive that comparison are trustworthy; records that contradict the world are defects, no matter how cleanly they passed every automated rule. This is the workflow we run on every dataset that reaches the desk, refined for 2026.
It sounds obvious, and most of the time nobody does it. The failure mode is not badly typed columns. It is a complete, tidy, referentially intact dataset that is missing an entire category of real entities, which means every number you publish from it is confidently wrong.
Table of Contents
- What You Need
- Step-by-Step
- 1. Define What You Are Validating
- 2. Audit Provenance and Collection Methods
- 3. Inspect Structure, Coverage, and Data Quality
- 4. Sample the Dataset
- 5. Cross-Check Against Independent Reality
- 6. Test for Plausible Patterns and Anomalies
- 7. Document Findings and Confidence
- When There Is No Ground Truth to Compare Against
- Automated Checks Versus Reality Checks
- Common Mistakes
- Frequently Asked Questions
- Conclusion
What You Need
You cannot reality-check a dataset with nothing but the dataset. Gather these five things first, and the checks later go fast.
- The source files themselves, plus every derived file your team has already built from them. Derived files inherit every defect of the parent and add their own.
- Metadata and documentation: a data dictionary, a methodology note, a revision history, a changelog, and whatever the creator publishes about known errors.
- Reference records: the original source documents, filings, or internal system screenshots that each row was supposedly created from.
- Comparison datasets with an independent authority behind them: census totals, a regulator’s registry, a licensing body, another agency’s published statistics.
- Analysis tools that fit your newsroom. A SQL client and a spreadsheet cover most checks. Schema validation and pipeline testing frameworks add reach, not judgement.
Also pin the vintage. Record the exact URL, the retrieval date, the file hash and any version string. The same public URL can return different numbers next quarter, and an unpinned figure is not reproducible.
Step-by-Step
Seven stages, roughly in the order that avoids wasted effort. Start cheap and structural, move to expensive and physical, and write down what you could not check at all.
1. Define What You Are Validating
Turn the dataset into a short list of specific, testable claims before you open a single value. Typical claims: the file covers every registered business in England; each row represents one real site; the population column is measured in whole persons, not thousands; every incident date falls inside the reporting window.
Write the coverage boundary down too, because most verification arguments are really boundary arguments. A dataset can be perfectly accurate about what it covers and useless for a question that reaches outside it. You know the scope is clear when two people reading your claims would build the same validation plan from them.
2. Audit Provenance and Collection Methods
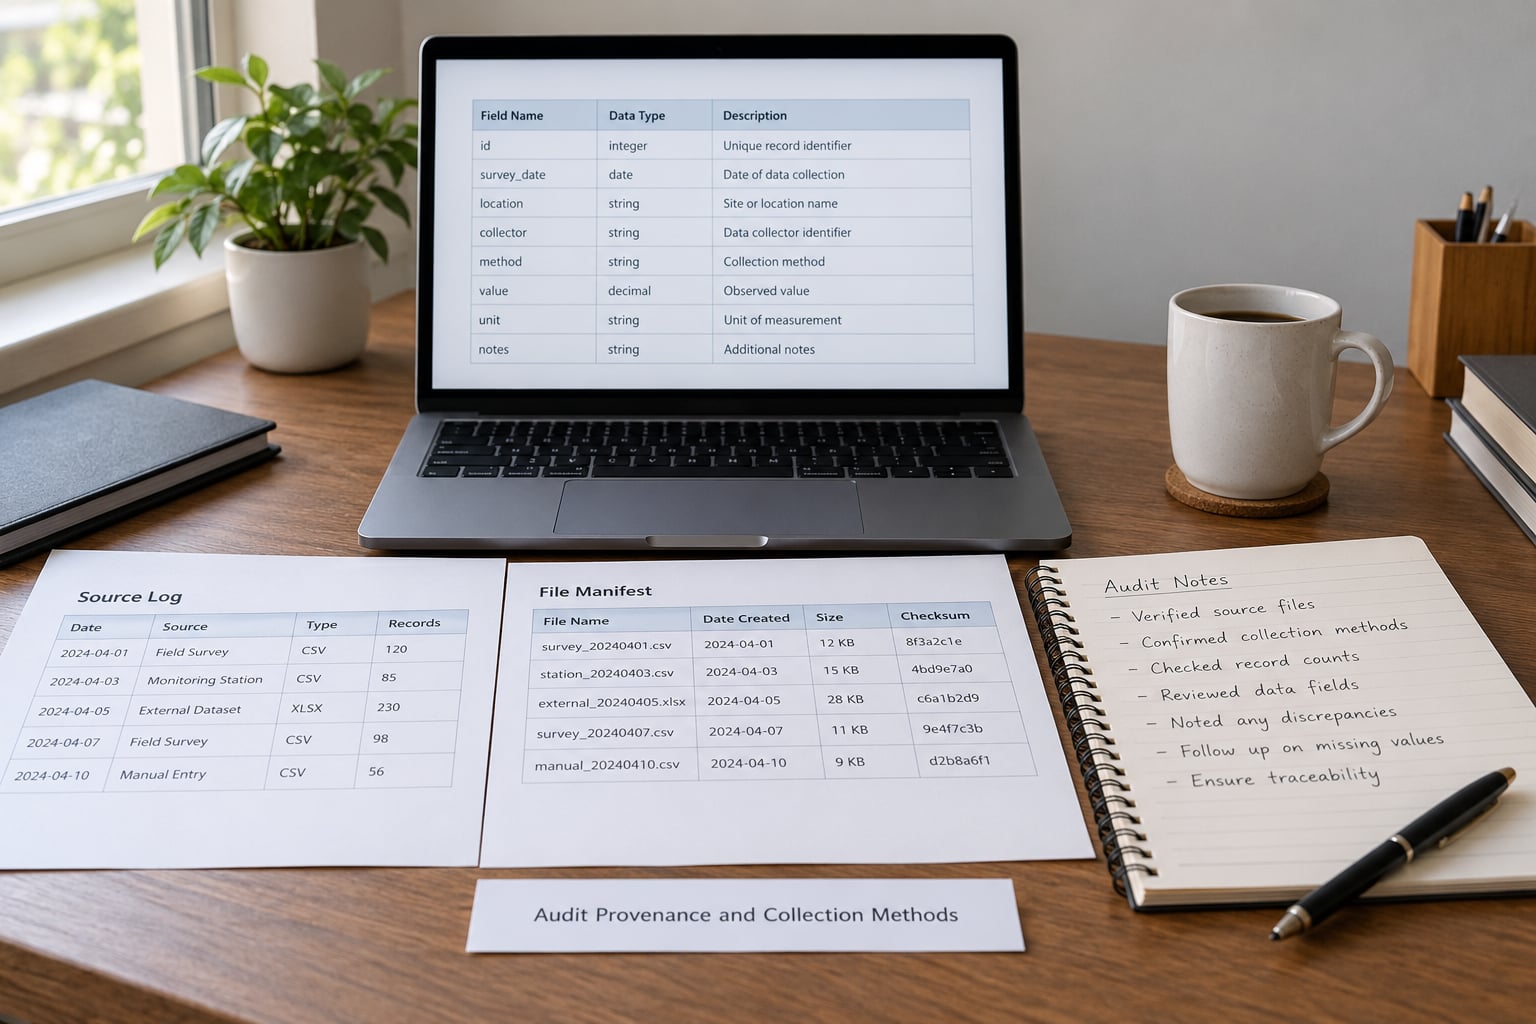
Ask who made this, from what, by what process, and what was thrown away. Provenance means you can name the collecting organisation, the source-to-target mapping, the transformations applied after collection, the exclusions, the update schedule and the known failure modes.
Then list what the documentation does not explain. That gap list is your risk register, and it is more useful than the documentation itself. Nineteen questions in twenty are answered; the twentieth is usually where the story breaks. Older datasets also carry embedded local meanings, where a category label meant one thing to the team that created it and now means something else entirely, and no rule engine can catch that.
3. Inspect Structure, Coverage, and Data Quality
Profile before interpreting. Check row counts against the source, field types, null rates per column, duplicate record rates, distinct value counts per column, date ranges, geographic coverage, and category consistency. Look specifically for unit changes mid-series, since a metric that switches from units to thousands without a note will produce a jump that looks like a trend.
Two checks catch more than the rest. Referential integrity tells you whether every foreign key resolves to a record that exists, which exposes coverage gaps rather than errors. Coverage tells you which real-world categories are absent entirely, which is the defect that completeness counts can never reveal. A field that is 40% null is not automatically broken, but you should know why before you use it.
4. Sample the Dataset
Draw three samples, because each catches a different failure. A simple random sample gives you a defensible error rate. A stratified sample, split across region, category, size band or time period, catches defects concentrated in one slice. A targeted sample, built from your gap list and your extreme values, catches systematic problems that random sampling would likely miss.
Keep an audit trail: the seed, the sampling method, the record identifiers, the date, and the person who ran it. Then compare each sampled record against the original source record, not against a colleague’s memory of it. In a water utility migration described by John Morris on Data Quality Pro, the dataset listed one pump where the plant physically had two. An area manager asking “can you count?” was enough to destroy confidence in the whole migration, and only a physical visit would have caught it.
5. Cross-Check Against Independent Reality
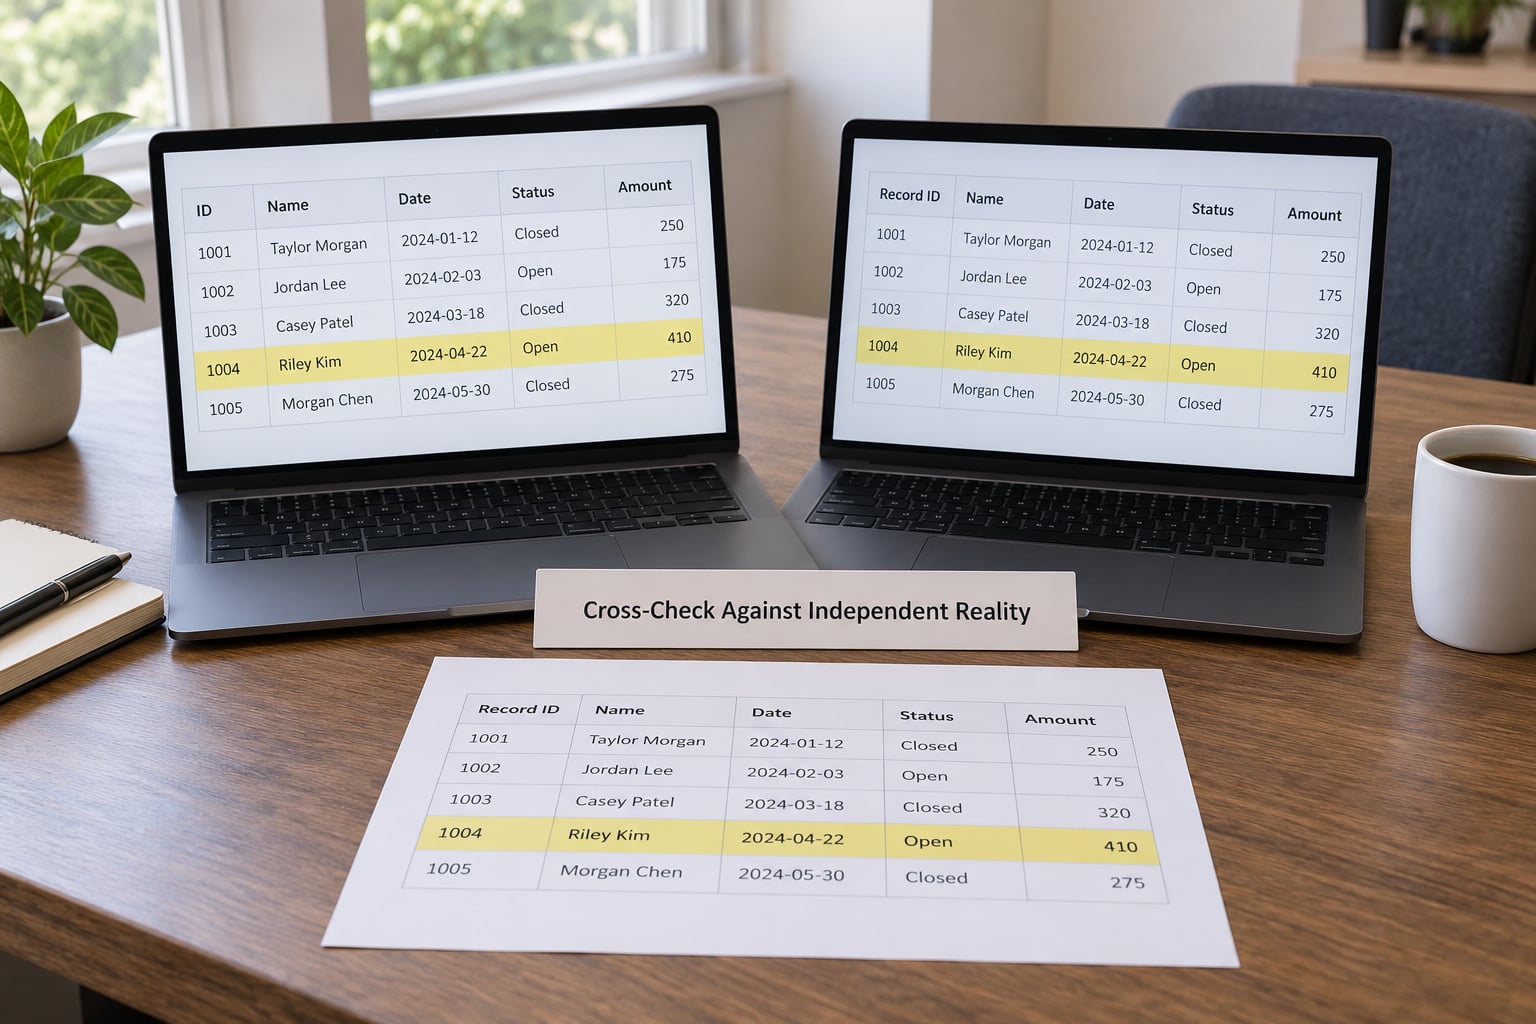
This is the triangulation step, and it is the one most often skipped. Reconcile your totals against an independent authoritative denominator, such as a census count, a regulatory registry or an audited published total. A population table that sums to 94% of the official regional count has a coverage gap even if every row looks clean.
Match records to independent evidence in the same units, definitions and time periods, and write down every mismatch you had to adjust for. A national register counts incorporated companies only; a local register counts sole traders too. Definitional differences explain disagreement far more often than error does, and conflating the two wrecks the reconciliation.
Bring in a domain expert where the semantics are contested. Someone who has actually stood on the site, read the filings or run the process will catch a category that is technically populated and practically meaningless.
6. Test for Plausible Patterns and Anomalies
Aggregate checks find what row-level checks miss. Compare totals, distributions, ratios and time series against a baseline series you trust, and treat any gap beyond the expected revision margin as a question rather than a finding. Watch for abrupt breaks, values that repeat in blocks, impossible values such as negative counts where negatives are impossible, and duplicates that inflate totals.
Sentinel values deserve their own pass. A blank recorded as zero, a 999 meaning unknown, a -99 meaning not applicable: each one is a real number to the database and silently wrong to your analysis. Worked example: 100 rows where 53 carry a zero sentinel, and you compute a mean cost across all 100 instead of the 47 valid ones. Your result is the true mean multiplied by 0.47, and it looks entirely plausible. The World Bank project evaluation dataset, where 53% of entries recorded a lending cost of zero, is the widely cited version of this failure, and every per-country cost analysis computed over it inherited the error.
7. Document Findings and Confidence
Classify every claim from step 1 as verified, partly verified, unresolved, or contradicted, and attach the evidence to that label. “Unresolved” is a legitimate outcome and far more useful than silence. State your confidence level in plain words, list what you checked, and list what you could not check.
Write it as a reproducible note rather than a summary. Name the exact record that contradicts reality, name the tool and the check you ran, and give anyone else enough to repeat it. That record-level evidence is what survives contact with a sceptical stakeholder, because summary statistics are what arguments are made of, and they are what people dispute.
When There Is No Ground Truth to Compare Against
The most common real version of this problem is that the source is the only reference you have. No independent record exists, at least not one you can find. Four indirect methods still work.
- Internal consistency tests. Physically impossible combinations, contradictory fields, totals that fail basic accounting identities. These prove internal coherence, which is necessary but not sufficient.
- Proxy correlation against unrelated series. Compare your series to an independent measure of the same underlying reality, such as a different agency’s version of the same trend. Agreement in level and direction is weak but real evidence.
- Holdout comparisons. Keep a set of records aside, verify those against ground truth you can access for that subset, then apply the result as an error estimate for the rest.
- Domain expert calibration. Have two reviewers independently classify the same slice and measure agreement between them. Disagreement locates the ambiguity, which is usually where the error lives.
If none of these produce a defensible error estimate, say so in the methodology note and lower your confidence accordingly. Publishing with an honest coverage gap is defensible. Publishing as if the data were ground truth is not.
Automated Checks Versus Reality Checks
| Check | What it can tell you | What it cannot tell you |
|---|---|---|
| Schema and type validation | Columns match the declared structure | Whether any value describes reality |
| Null and duplicate detection | Missing and repeated records | Whether real entities are absent entirely |
| Referential integrity | Every foreign key resolves | Whether the referenced record is correct |
| Range and outlier rules | Values outside expected bounds | Whether an in-range value is wrong |
| Anomaly and drift detection | Where the series departs from baseline | Whether the departure is real or an error |
| Reality check against independent evidence | Whether records correspond to things that exist | Anything about records you never sampled |
Schema validation, pipeline testing frameworks and profiling tools are worth your time, and every one of them operates on the dataset alone. That is the limit. The Verification Handbook for Investigative Reporting puts the same point more bluntly: not even the best data analysis replaces on-the-ground verification, which is why investigative teams verify data twice, once at the point of gathering and again after analysis.
Common Mistakes
- Treating completeness as accuracy. A full row count proves nothing about coverage. Fix: reconcile totals against an independent denominator before you read a single value.
- Comparing mismatched definitions. Two datasets disagree because they count different things. Fix: write the definitional differences down before treating a gap as an error.
- Checking only averages. A mean can hide an entire missing category. Fix: compare distributions, medians and tails, not just the centre.
- Ignoring missing data. Dropping incomplete rows without recording the drop changes your population. Fix: report null rates per column and state the exclusion rule.
- Trusting derived figures without tracing them. If you cannot name the transformation that produced a number, you cannot check it. Fix: follow it back to the source record.
- Not pinning the vintage. An unpinned public dataset cannot be reproduced or defended. Fix: record the URL, retrieval date and file hash with the finding.
- Declaring verification from a small or biased sample. Twenty records pulled from one region prove nothing about national coverage. Fix: stratify the sample and state the error rate it supports.
One case deserves its own handling: the source insists the data is right. Practitioners on Reddit’s r/data and r/datascience describe the same loop, where showing that a check fails changes nothing because the argument stays at the level of method. It usually breaks when you move from “the data is wrong” to “this record, here, contradicts something you can go and look at.” Show the specific failing record, show the independent evidence, and ask them to explain that one case.
Frequently Asked Questions
How large a sample is enough to check a source dataset against reality?
Enough to support the claim you are making, which is rarely a round number anyone can quote. For a rough error rate on a large dataset, a few hundred randomly drawn records usually give a usable estimate, and stratified samples of that size across region or category catch far more than the same number drawn at random. Targeted samples can be much smaller because you are hunting a specific defect. Always report the method and the rate it supports, not just the count.
What should I do when two reliable datasets disagree?
Assume a definitional or time-period difference before you assume error. Check unit of measure, coverage boundaries, revision vintage and category definitions side by side, and recompute one small slice of each on identical definitions. If the gap survives that, quantify it, attribute both sources, and report the disagreement explicitly rather than silently picking one. A documented conflict is more trustworthy than a clean number with a hidden choice behind it.
Can automated checks prove that a dataset is accurate?
No. Schema validation, referential integrity, profiling and anomaly detection all operate on the dataset alone, so they can prove it is well-formed and internally consistent, and nothing more. A dataset can pass every automated rule and still omit a whole category of real entities. Automated checks are excellent at narrowing where to look; the accuracy verdict always comes from comparison against something outside the dataset.
How should I document uncertainty in a newsroom analysis?
Publish a methodology note alongside the finding, not in a separate archive. It should name the dataset, its vintage, the checks you ran, the sample method and size, what failed, and what you could not check at all. State your confidence in plain words rather than a number pulled from nowhere. Readers and editors can then judge which figures carry weight and which are provisional.
When is a dataset not reliable enough to publish?
When a sampled record contradicts reality and you cannot explain why, when coverage cannot be reconciled with an independent denominator, or when the definition of the thing being counted is unresolved. Also when provenance is missing to the point that nobody can say where the records came from. The workable standard is proportionate transparency: publish with a stated limit and a confidence level, hold back when the error could change the conclusion.
Conclusion
Seven stages, in this order: define the claims, trace provenance, profile structure, sample, cross-check against independent reality, test for plausible patterns and anomalies, then document the result with its gaps intact. The order matters because each stage saves work on the next.
Start with the first three today. Write down one specific claim the dataset is supposed to support, name who collected it and when, and document one reproducible spot-check on a single record you can trace to its origin. That single check will teach you more about a dataset than an hour of profiling.